

Elasticsearch is a powerful search and analytics engine, but configuration issues, resource limitations, networking problems, or cluster misconfigurations can prevent it from starting or cause instability.
This tutorial walks through the most common Elasticsearch problems and shows you how to diagnose and fix them step by step. Whether Elasticsearch refuses to start, reports memory errors, fails bootstrap checks, or shows unhealthy cluster status, you’ll find practical solutions below.
Prerequisites
- Administrative (sudo) access to the server
- Elasticsearch installed and managed through systemd
- Access to Elasticsearch configuration files and logs
- Basic familiarity with Linux command-line operations
Quick Elasticsearch Fix Checklist
Before exploring into detailed troubleshooting, run through this checklist:
- Check service status and logs
- Verify the Elasticsearch API is responding
- Review cluster health
- Increase OS resource limits if required
- Verify data and log directory permissions
- Validate Elasticsearch configuration
- Resolve bootstrap check failures
- Restart Elasticsearch and verify cluster status
Step 1: Check Whether Elasticsearch Is Running
The first step is confirming whether the service is running correctly.
Run:
sudo systemctl status elasticsearch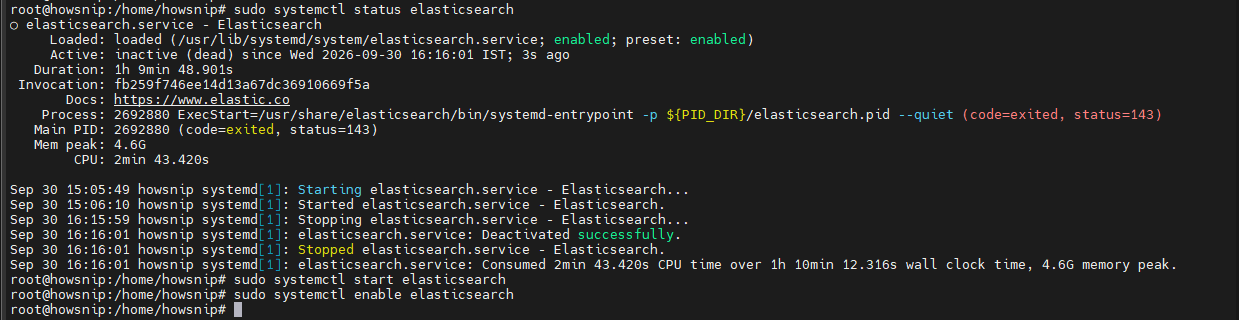
This command displays the current Elasticsearch service status, including whether it is active, failed, or stopped.
If Elasticsearch is not running, start it manually:
sudo systemctl start elasticsearchTo ensure Elasticsearch starts automatically after a reboot:
sudo systemctl enable elasticsearchIf the service shows a failed or crashed state, note any error messages and continue with log analysis.

Step 2: Review Elasticsearch Logs
Logs usually provide the exact reason Elasticsearch failed to start.
a) View Systemd Logs
sudo journalctl -u elasticsearch -xe --no-pager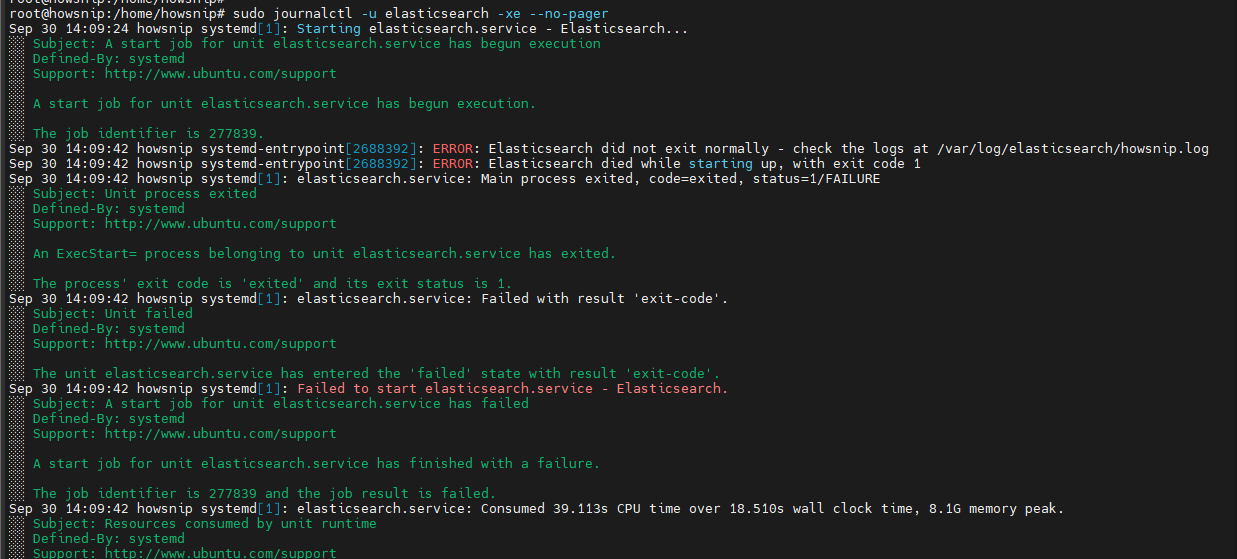
This displays recent service events and startup errors.
b) View Elasticsearch Log File
sudo tail -n 200 /var/log/elasticsearch/elasticsearch.log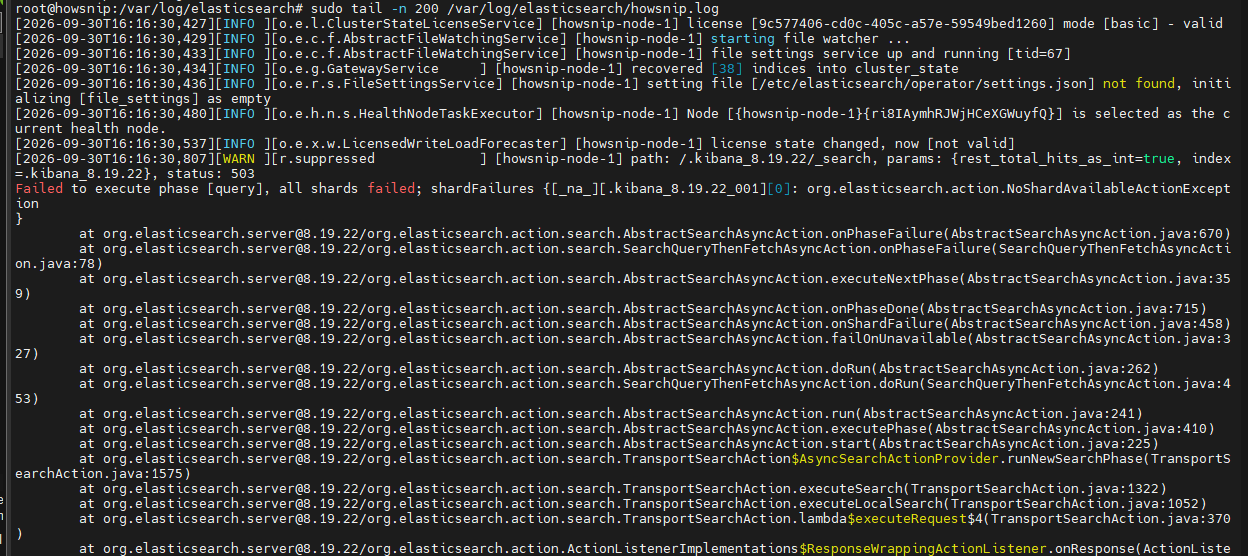
This command shows the latest Elasticsearch application logs.
c) View Garbage Collection Logs
sudo tail -n 200 /var/log/elasticsearch/gc.log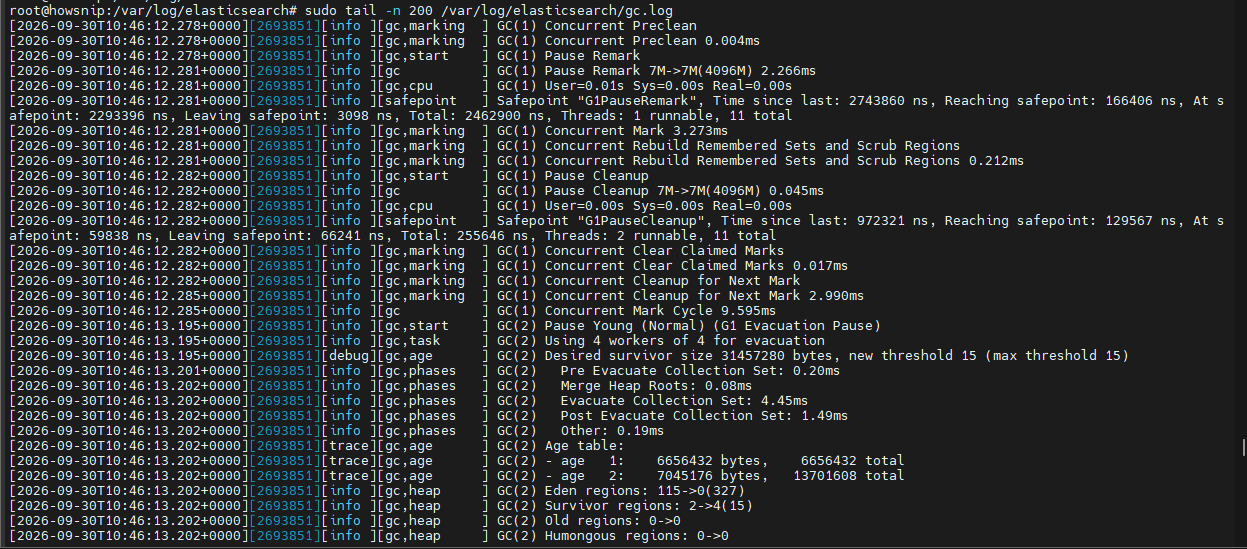
This is useful for identifying memory pressure and excessive garbage collection activity.
Common Error Messages to Look For
- OutOfMemoryError
- bootstrap checks failed
- vm.max_map_count
- max file descriptors too low
- address already in use
- permission denied
- cluster_block
- disk watermark exceeded
Step 3: Verify Elasticsearch API and Ports
Once Elasticsearch appears to be running, verify it is accepting requests.
a) Test the API Endpoint
curl -s http://127.0.0.1:9200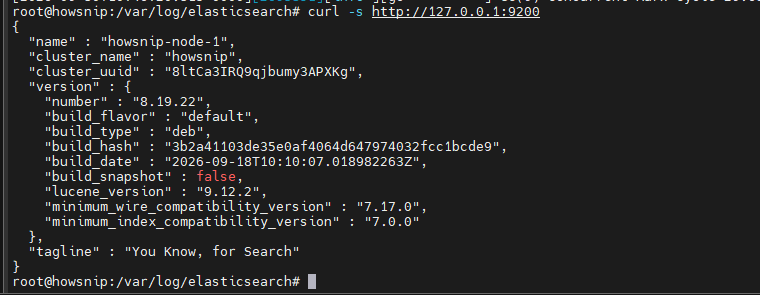
This should return Elasticsearch version and cluster information.
b) Check Cluster Health
curl -s http://127.0.0.1:9200/_cluster/health?pretty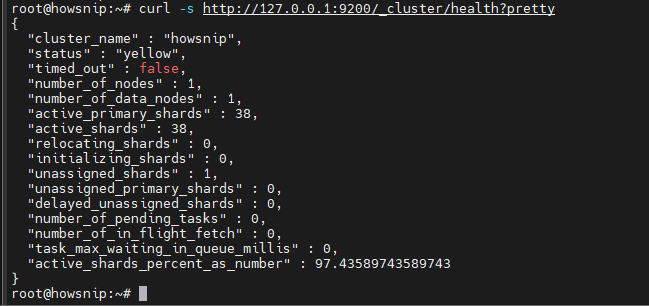
The output shows the current cluster status and health metrics.
c) Verify Elasticsearch Ports
ss -ltnp | grep -E "9200|9300"Or:
netstat -ltnp | grep -E "9200|9300"
Port usage:
- 9200 = HTTP API
- 9300 = Inter-node transport communication
If another application is already using these ports, stop the conflicting service or configure Elasticsearch to use different ports.
Common Startup Failures and Their Fixes
a) Fix JVM Heap and Memory Errors
Symptoms
- OutOfMemoryError
- Long garbage collection pauses
- Process terminated by the Linux OOM Killer
Configure JVM heap memory in the Elasticsearch JVM options file.
sudo sed -i 's/^-Xms.*/-Xms4g/' /etc/elasticsearch/jvm.options
sudo sed -i 's/^-Xmx.*/-Xmx4g/' /etc/elasticsearch/jvm.options
Restart Elasticsearch:
sudo systemctl restart elasticsearchBoth values should typically be identical to avoid memory resizing overhead.
Best Practice
- Allocate approximately 50% of system RAM.
- Avoid allocating more memory than physically available.
- Keep heap size below 31–32 GB when possible.
b) Fix vm.max_map_count Errors
Typical Error
max virtual memory areas vm.max_map_count is too lowIncrease the kernel limit:
echo "vm.max_map_count=262144" | sudo tee /etc/sysctl.d/99-elasticsearch.conf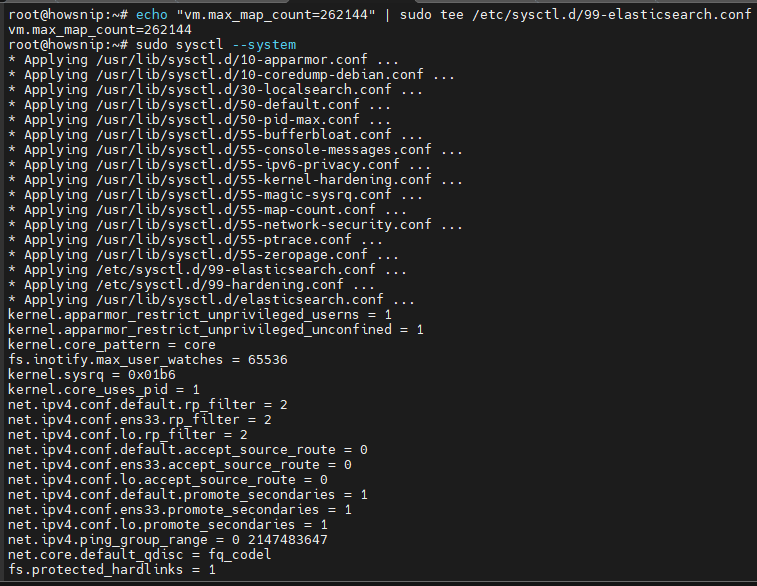
Apply the change:
sudo sysctl --systemRestart Elasticsearch afterward.
Elasticsearch uses many memory-mapped files and requires a higher virtual memory mapping limit than Linux’s default setting.
c) Fix File Descriptor Limit Issues
Typical Error
max file descriptors too lowIncrease file descriptor limits:
echo -e "elasticsearch soft nofile 65536\nelasticsearch hard nofile 65536" | sudo tee -a /etc/security/limits.conf
Create a systemd override:
sudo mkdir -p /etc/systemd/system/elasticsearch.service.dCreate the override file:
cat | sudo tee /etc/systemd/system/elasticsearch.service.d/override.conf <<'EOF'
[Service]
LimitNOFILE=65536
LimitNPROC=4096
EOF
Reload systemd:
sudo systemctl daemon-reload
sudo systemctl restart elasticsearch
Elasticsearch can open thousands of files and network connections simultaneously. Low limits often prevent startup.
d) Fix Permissions Problems
Typical Symptoms
- Permission denied errors
- Unable to write data
- Unable to create logs
Correct ownership:
sudo chown -R elasticsearch:elasticsearch /var/lib/elasticsearch /var/log/elasticsearchUpdate directory permissions:
sudo chmod -R 750 /var/lib/elasticsearch
sudo chmod -R 750 /var/log/elasticsearch
This ensures the Elasticsearch service account can access required directories.
Fix Java and JDK Issues
Modern Elasticsearch releases include a compatible Java runtime. If a custom Java installation is configured through JAVA_HOME, verify that it matches Elasticsearch requirements.
Recommendation
Use Elasticsearch’s bundled JDK whenever possible to avoid compatibility issues and version conflicts.
Fix Bootstrap Check Failures
When network.host is configured to a non-local address, Elasticsearch enables production-mode checks.
Common bootstrap checks include:
- Memory locking
- Heap configuration
- File descriptors
- Data path accessibility
- vm.max_map_count
Review the error message and correct every reported issue.
Important: Bootstrap checks should never be bypassed. Elasticsearch may become unstable if required settings are not properly configured.
Configure Networking Correctly
a) Configure Elasticsearch Network Settings
Edit:
nano /etc/elasticsearch/elasticsearch.yml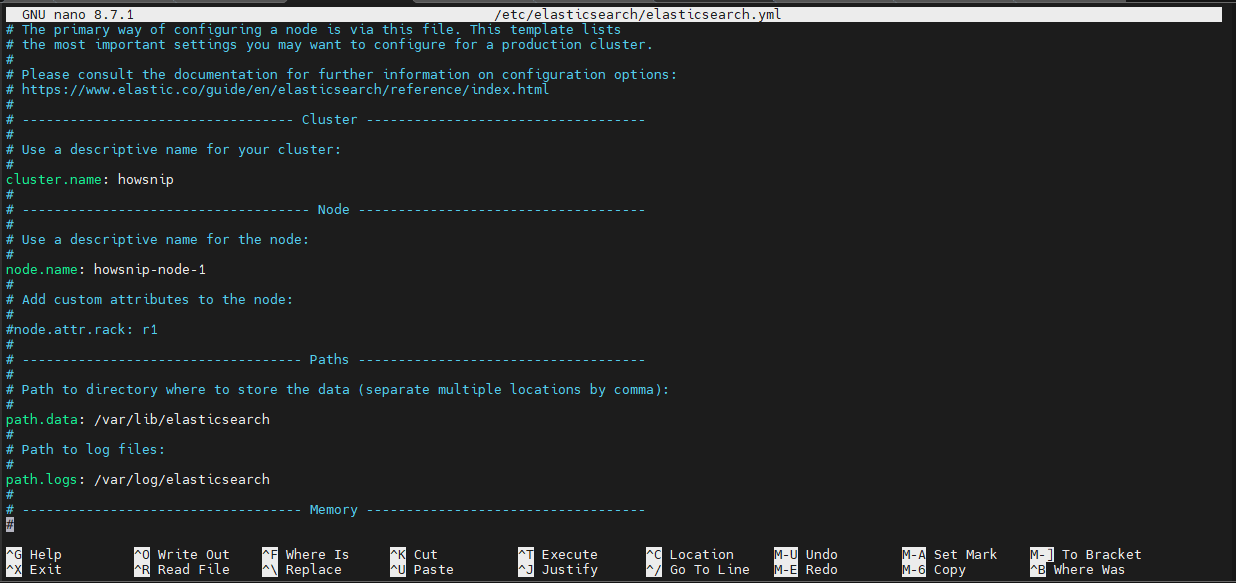
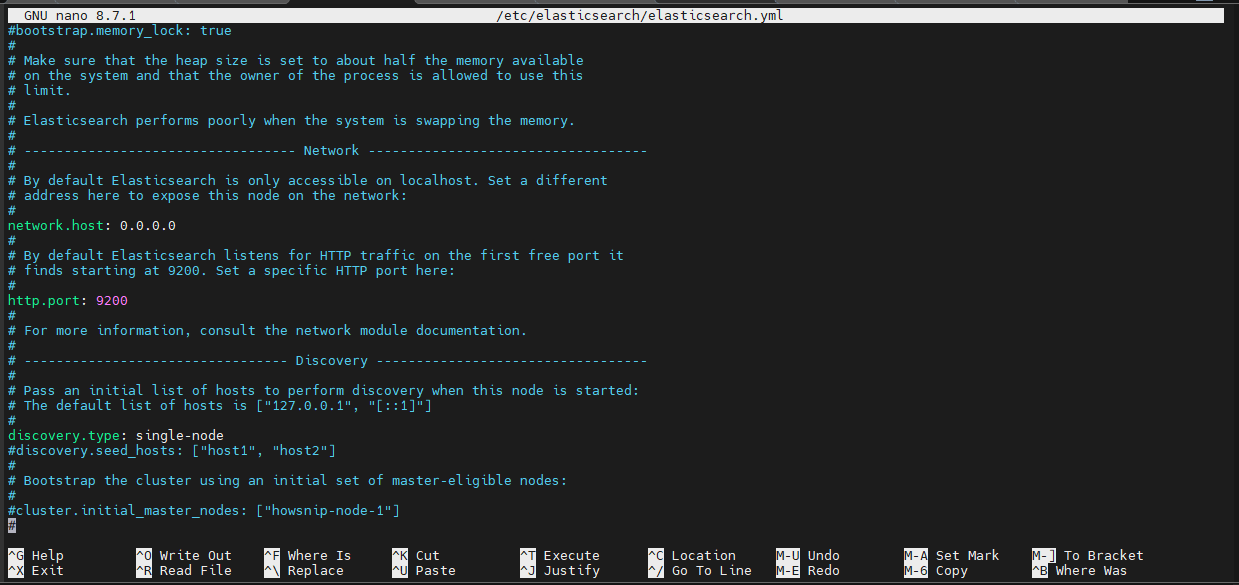
Example configuration:
network.host: 0.0.0.0
http.port: 9200
transport.port: 9300
If you see an address already in use error, another service is using the configured port.
b) Open Firewall Ports
Ubuntu/Debian (UFW)
sudo ufw allow 9200/tcp
sudo ufw allow 9300/tcp
RHEL/CentOS (firewalld)
sudo firewall-cmd --add-port=9200/tcp --permanent
sudo firewall-cmd --add-port=9300/tcp --permanent
sudo firewall-cmd --reload
This allows Elasticsearch traffic through the system firewall.
SELinux Considerations
On SELinux-enabled systems, Elasticsearch may be prevented from:
- Accessing data directories
- Writing logs
- Binding to network ports
While troubleshooting, you can test functionality in permissive mode or create appropriate SELinux policies for production use.
Configure Multi-Node Cluster Discovery
For multi-node deployments, nodes must be able to locate each other.
Example configuration:
cluster.name: mycluster
node.name: node-1
discovery.seed_hosts:
- "10.0.0.11"
- "10.0.0.12"
cluster.initial_master_nodes:
- "node-1"
- "node-2"
- "node-3"
Incorrect discovery settings can cause:
- Cluster formation failures
- Split clusters
- Isolated nodes
Also ensure all nodes use synchronized time through NTP or Chrony.
Check Cluster Health After Startup
Verify overall cluster status:
curl -s localhost:9200/_cluster/health?pretty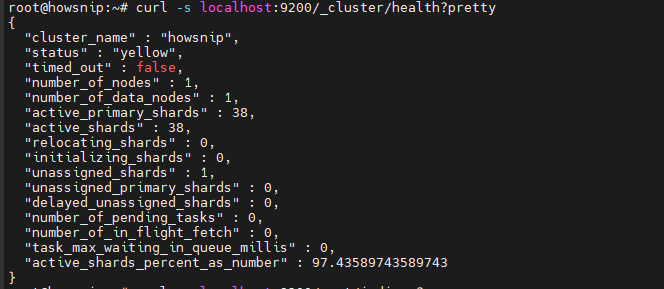
List indices:
curl -s localhost:9200/_cat/indices?vList shard allocation:
curl -s localhost:9200/_cat/shards?v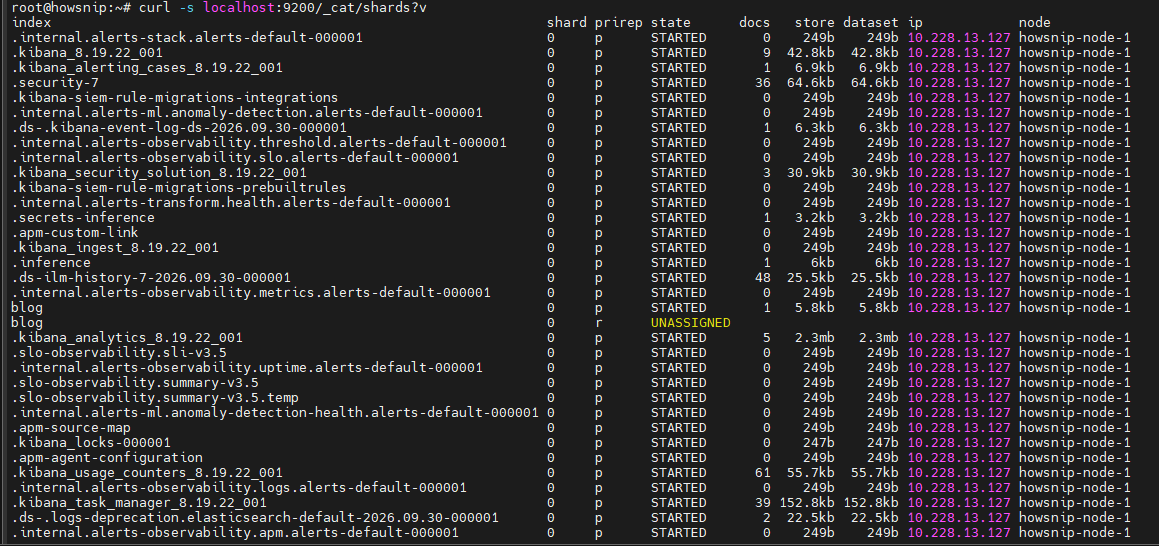
Understanding Cluster Status
- Green = Everything healthy
- Yellow = Replicas unavailable
- Red = Primary shards unavailable
Yellow or red states often indicate shard allocation problems.
Fix Disk Watermarks and Read-Only Indices
Check disk allocation settings:
curl -s localhost:9200/_cluster/settings?include_defaults=true | jq '.defaults.cluster.routing.allocation.disk'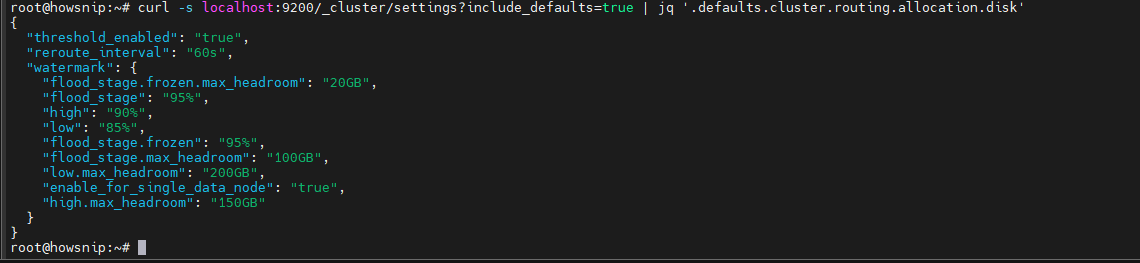
If indices become read-only because of low disk space:
curl -X PUT localhost:9200/_all/_settings \
-H 'Content-Type: application/json' \
-d '{
"index.blocks.read_only_allow_delete": null
}'
Elasticsearch protects itself from running out of disk space by blocking writes when storage reaches critical thresholds. Free up disk space before removing read-only restrictions.
Resolve High CPU Usage and Garbage Collection Pressure
Common Symptoms
- Slow searches
- High CPU utilization
- Frequent GC pauses
- Nodes dropping from the cluster
Recommended actions:
- Review gc.log
- Reduce excessive shard counts
- Optimize index mappings
- Increase heap memory within safe limits
- Disable OS swap for production environments
You can also enable memory locking:
bootstrap.memory_lock: trueInvestigate Slow Queries and Hot Shards
When specific nodes or shards become overloaded:
- Use _nodes/hot_threads
- Review _tasks
- Rebalance shards when required
- Reduce oversharding
- Implement Index Lifecycle Management (ILM)
Hot shards are a common cause of uneven cluster performance.
Fix Plugin and Upgrade Issues
a) Check Installed Plugins
sudo /usr/share/elasticsearch/bin/elasticsearch-plugin list
The above command reviews the installed plugins after any Elasticsearch upgrade.
b) Remove Incompatible Plugins
sudo /usr/share/elasticsearch/bin/elasticsearch-plugin remove <name>Plugin version mismatches are a common reason for failed startups after upgrades.
Perform Safe Rolling Restarts
For production clusters, restart nodes one at a time.
Step 1: Disable Shard Allocation
PUT _cluster/settings
{
"transient": {
"cluster.routing.allocation.enable": "none"
}
}
Step 2: Upgrade One Node
- Stop the node
- Perform the upgrade
- Start the node
- Wait until the cluster returns to a healthy state
Step 3: Re-enable Allocation
PUT _cluster/settings
{
"transient": {
"cluster.routing.allocation.enable": null
}
}
Repeat the process for each remaining node.
Review Security-Related Issues
a) X-Pack Security
Recent Elasticsearch versions enable security by default.
Verify:
- User credentials
- Enrollment tokens
- HTTPS settings
- Client authentication configuration
Authentication and certificate problems are typically visible in Elasticsearch logs.
b) AppArmor, SELinux, and Systemd Restrictions
Security hardening frameworks may prevent Elasticsearch from:
- Accessing storage paths
- Creating logs
- Opening ports
Also review custom systemd service overrides to ensure restrictive options are not blocking normal Elasticsearch operations.
Useful Elasticsearch Commands Reference
a) Service and Logs
systemctl status elasticsearch
journalctl -u elasticsearch -xe --no-pager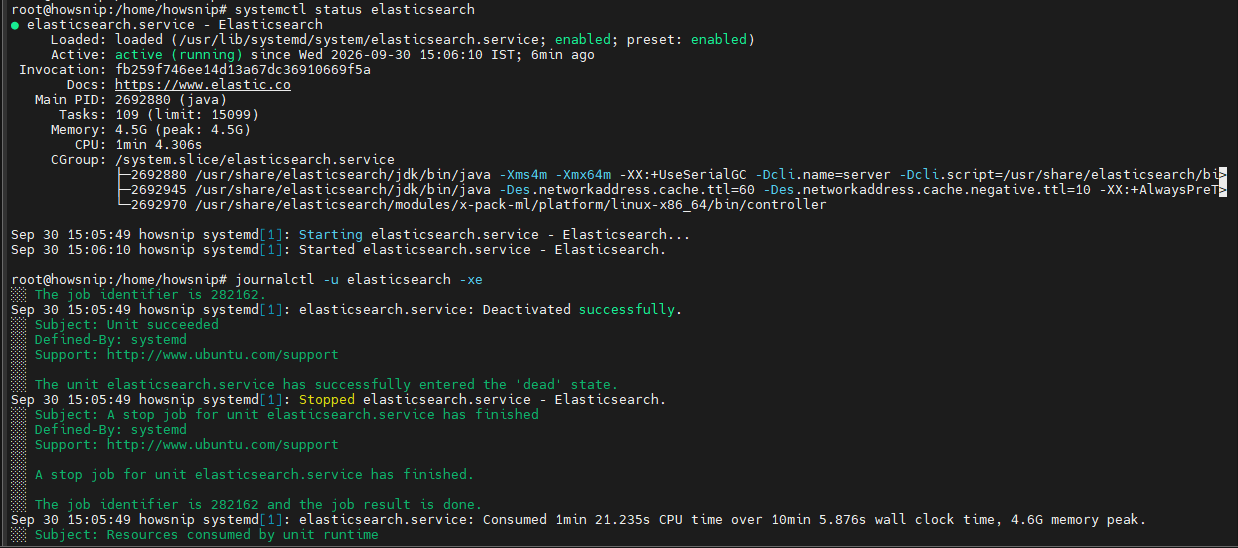
b) API Verification
curl -s localhost:9200
curl -s localhost:9200/_cluster/health?pretty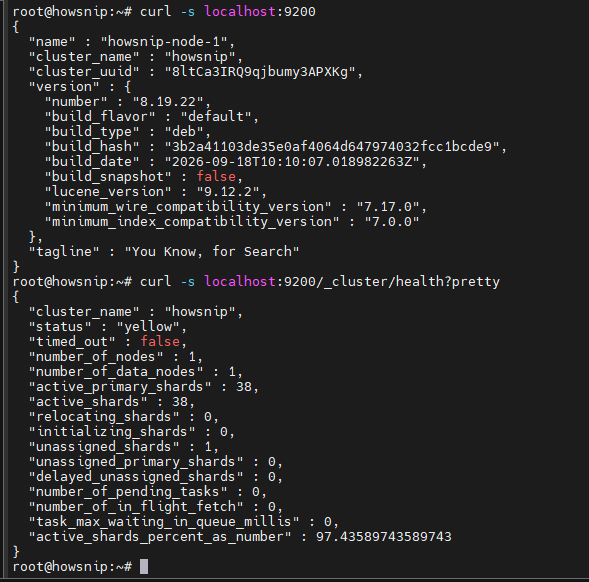
curl -s localhost:9200/_cat/nodes?v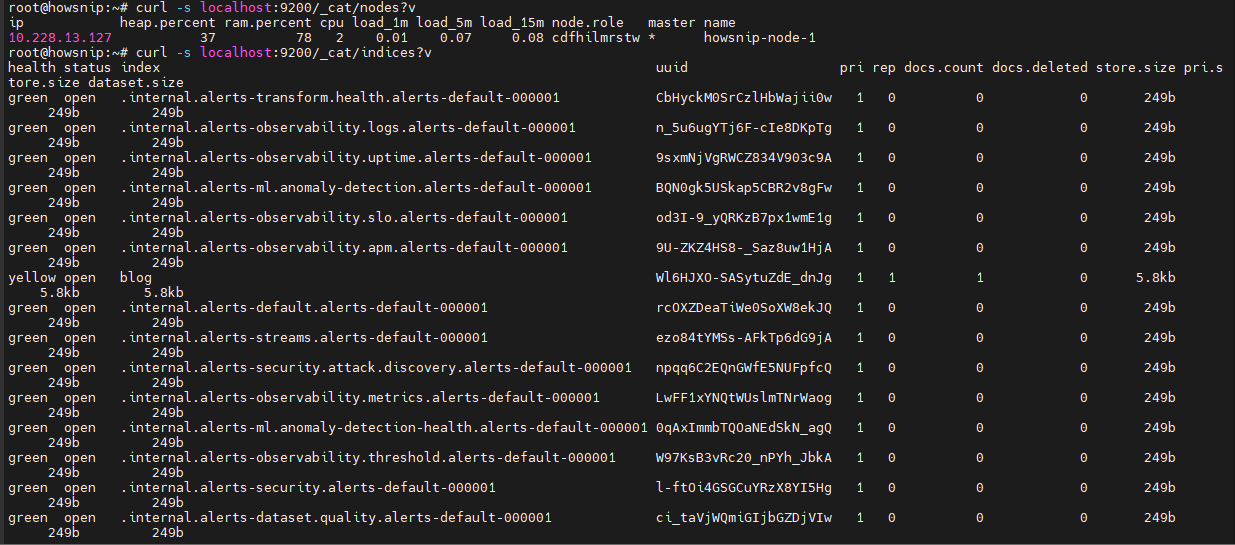
curl -s localhost:9200/_cat/indices?v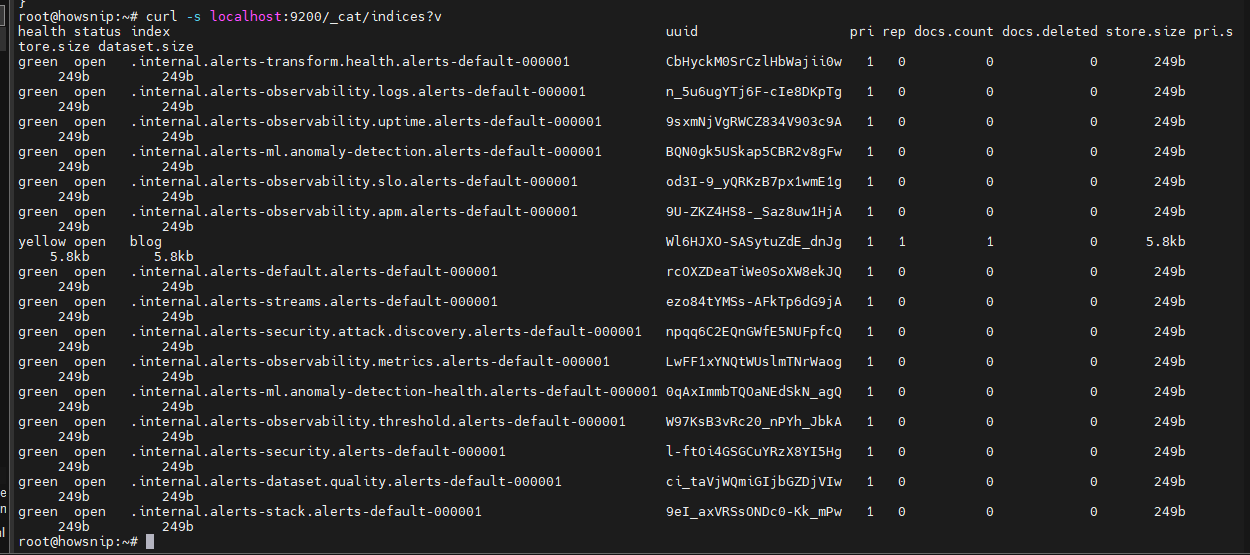
c) Operating System Settings
sysctl vm.max_map_count
ulimit -n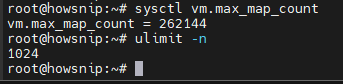
d) Important Files
- /etc/elasticsearch/elasticsearch.yml
- /etc/elasticsearch/jvm.options
- /var/log/elasticsearch/*.log
- /var/lib/elasticsearch/
Conclusion
Most Elasticsearch issues can be traced back to a few common areas: service failures, configuration mistakes, insufficient system resources, permissions problems, networking issues, or cluster misconfiguration. Start by checking the service status and logs, verify API connectivity, and then work through memory, file descriptor, and networking settings as needed.
By following this troubleshooting process step by step, you can quickly identify the root cause of Elasticsearch startup and stability problems and restore a healthy, reliable cluster.