

Building a SIEM (Security Information and Event Management) home lab is an excellent way to learn how modern security monitoring platforms collect, analyze, and detect suspicious activity. Using Elastic Cloud, it’s possible to create a cloud-based security monitoring environment without managing the underlying infrastructure.
This guide walks through the complete process of setting up a simple SIEM home lab using Elastic Cloud, connecting a Kali Linux virtual machine, collecting logs, creating dashboards, and configuring a custom detection rule for failed SSH login attempts.
1. Setting Up the Elastic Cloud Environment
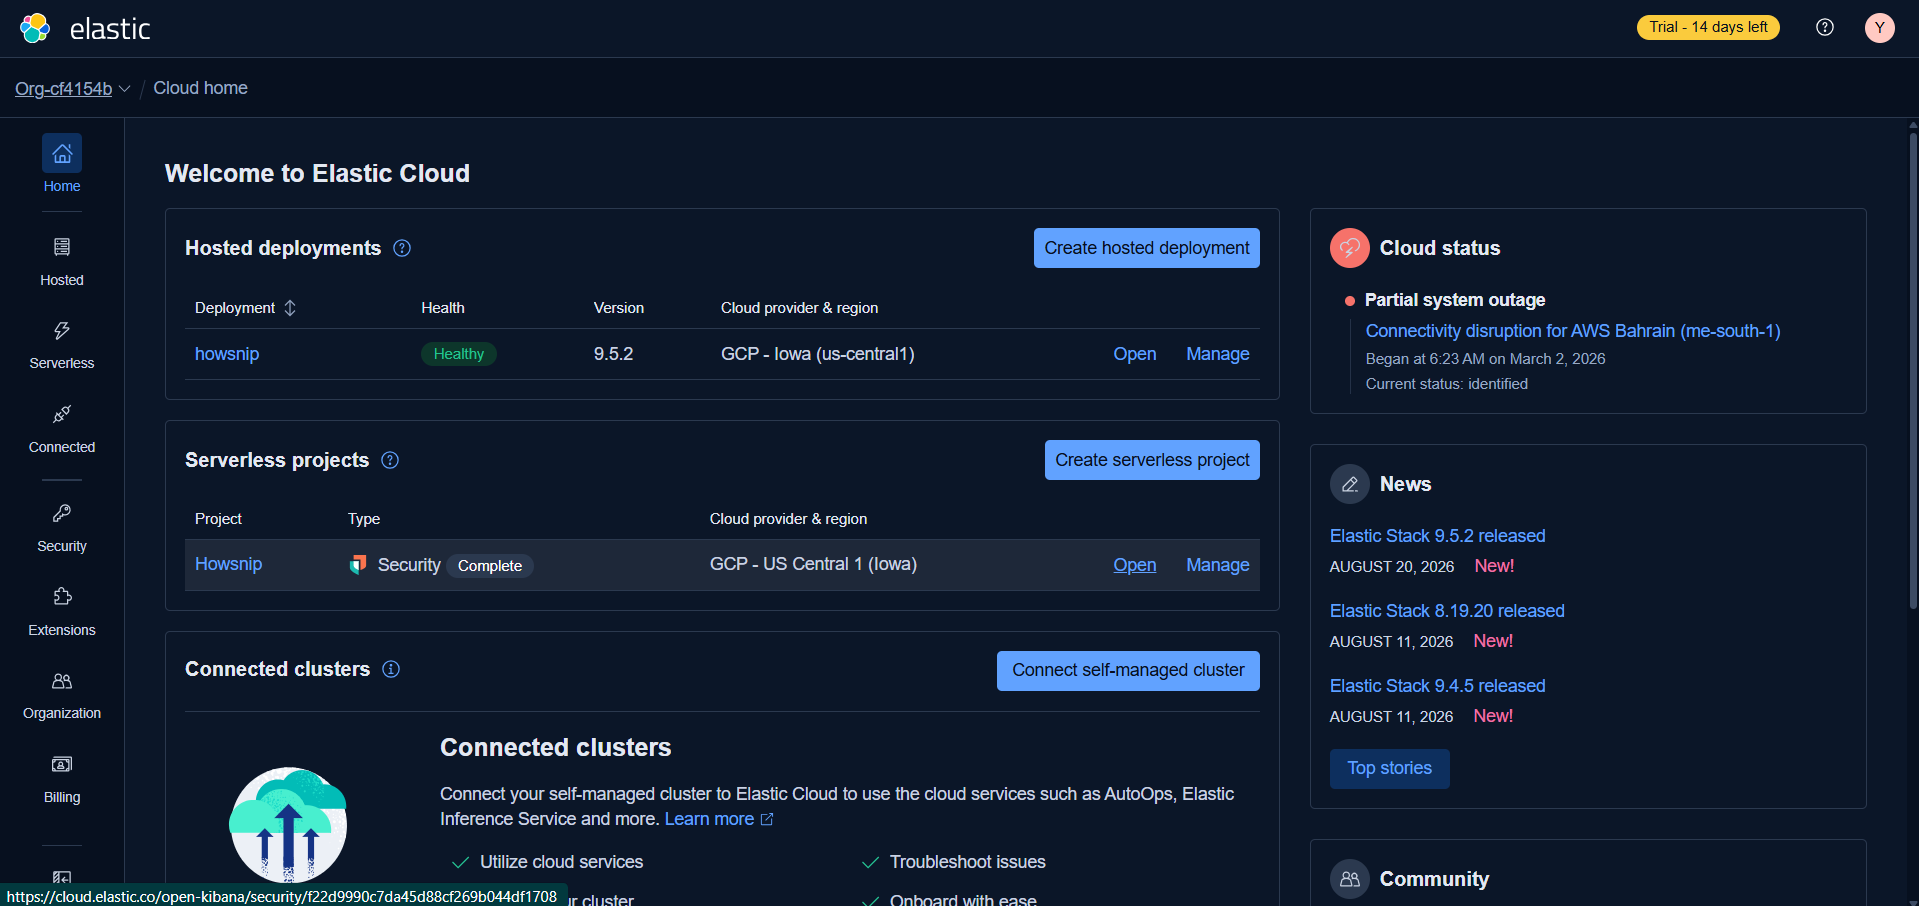
The first step is creating an Elastic Cloud account and accessing the Elastic Cloud platform. Elastic Cloud provides a hosted environment that includes Elasticsearch for data storage and search capabilities, along with Kibana for visualization and security analysis.
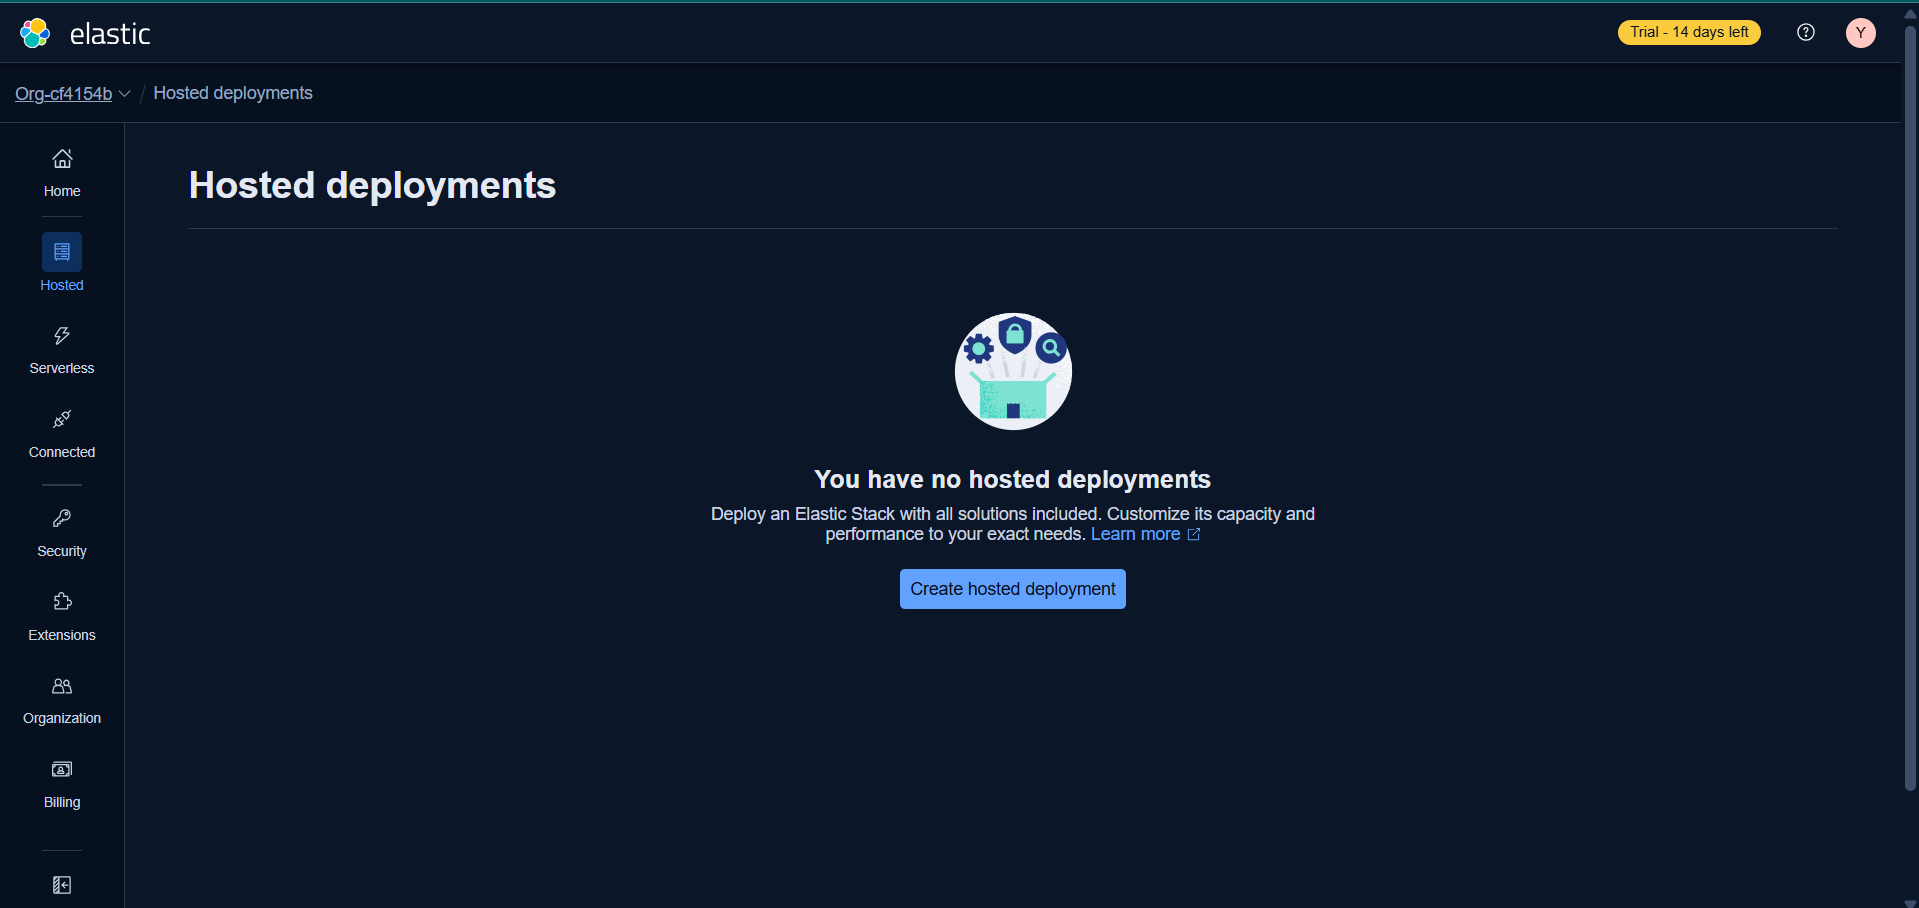
Once logged in, a new deployment can be created by selecting Elasticsearch as the deployment type. This deployment serves as the foundation of the SIEM environment, acting as the central location where logs and security events are stored, indexed, and analyzed.
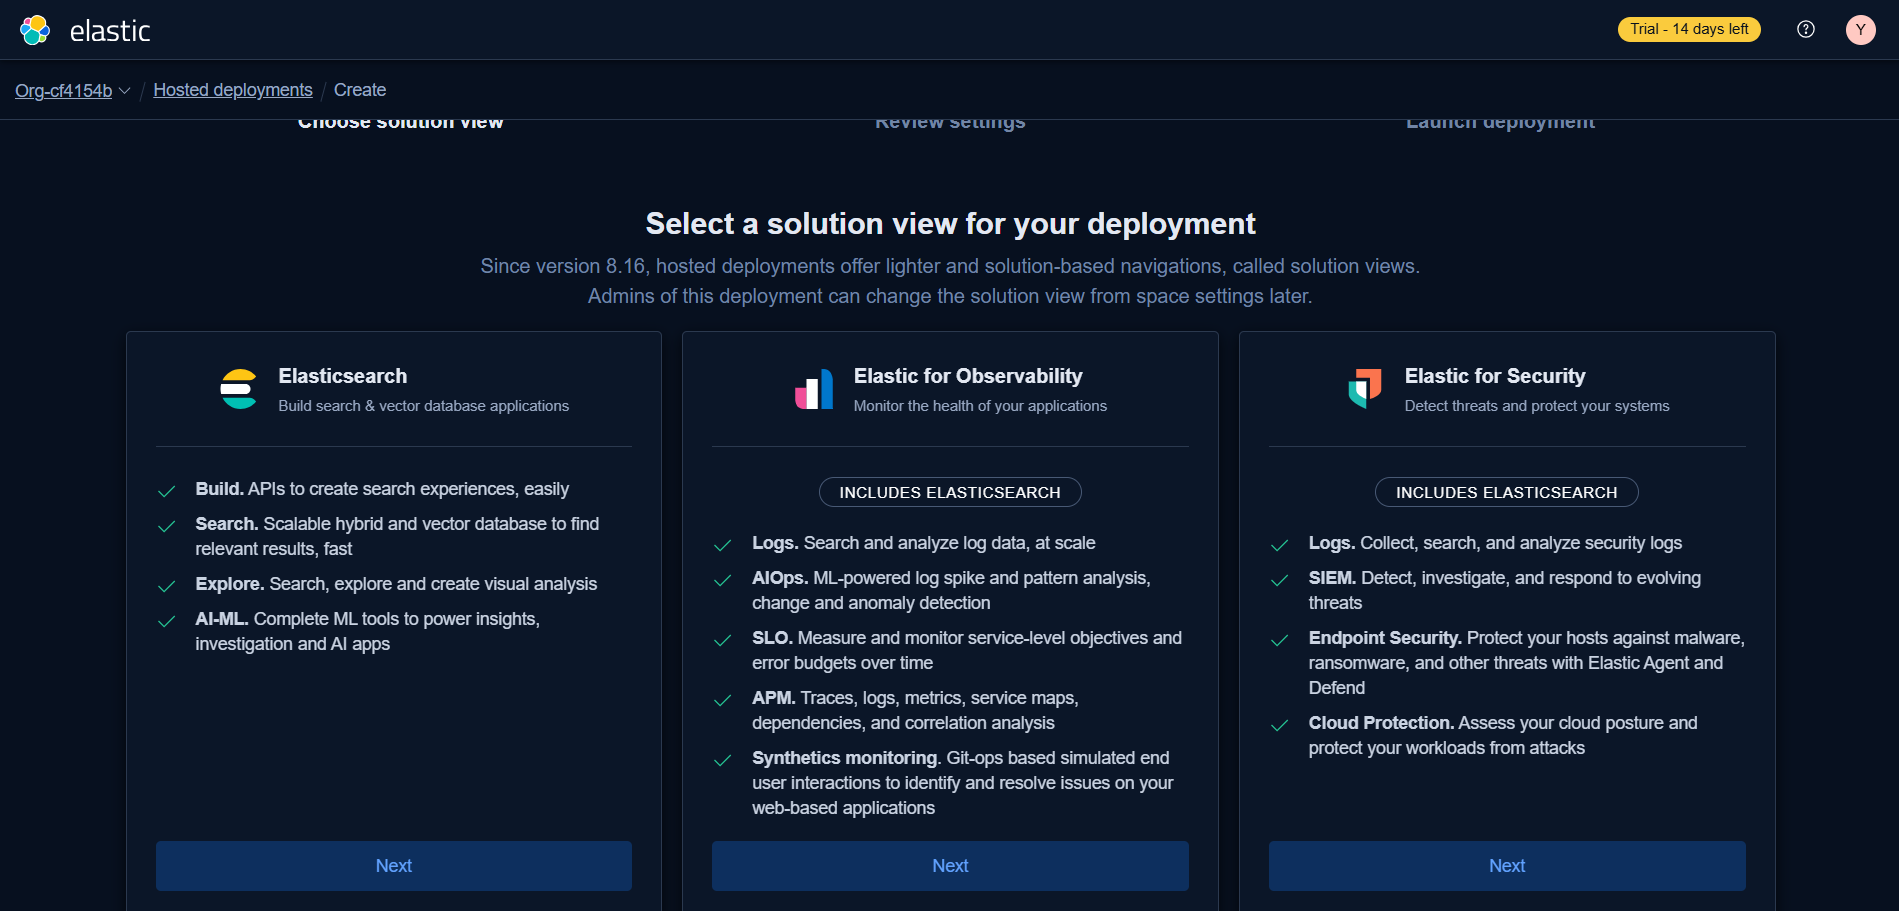
Choosing Deployment Settings
During deployment creation, the required cloud region and deployment configuration must be selected.
These settings determine where the Elasticsearch and Kibana resources are hosted. After confirming the selections and clicking Create Deployment, Elastic automatically provisions the necessary infrastructure.
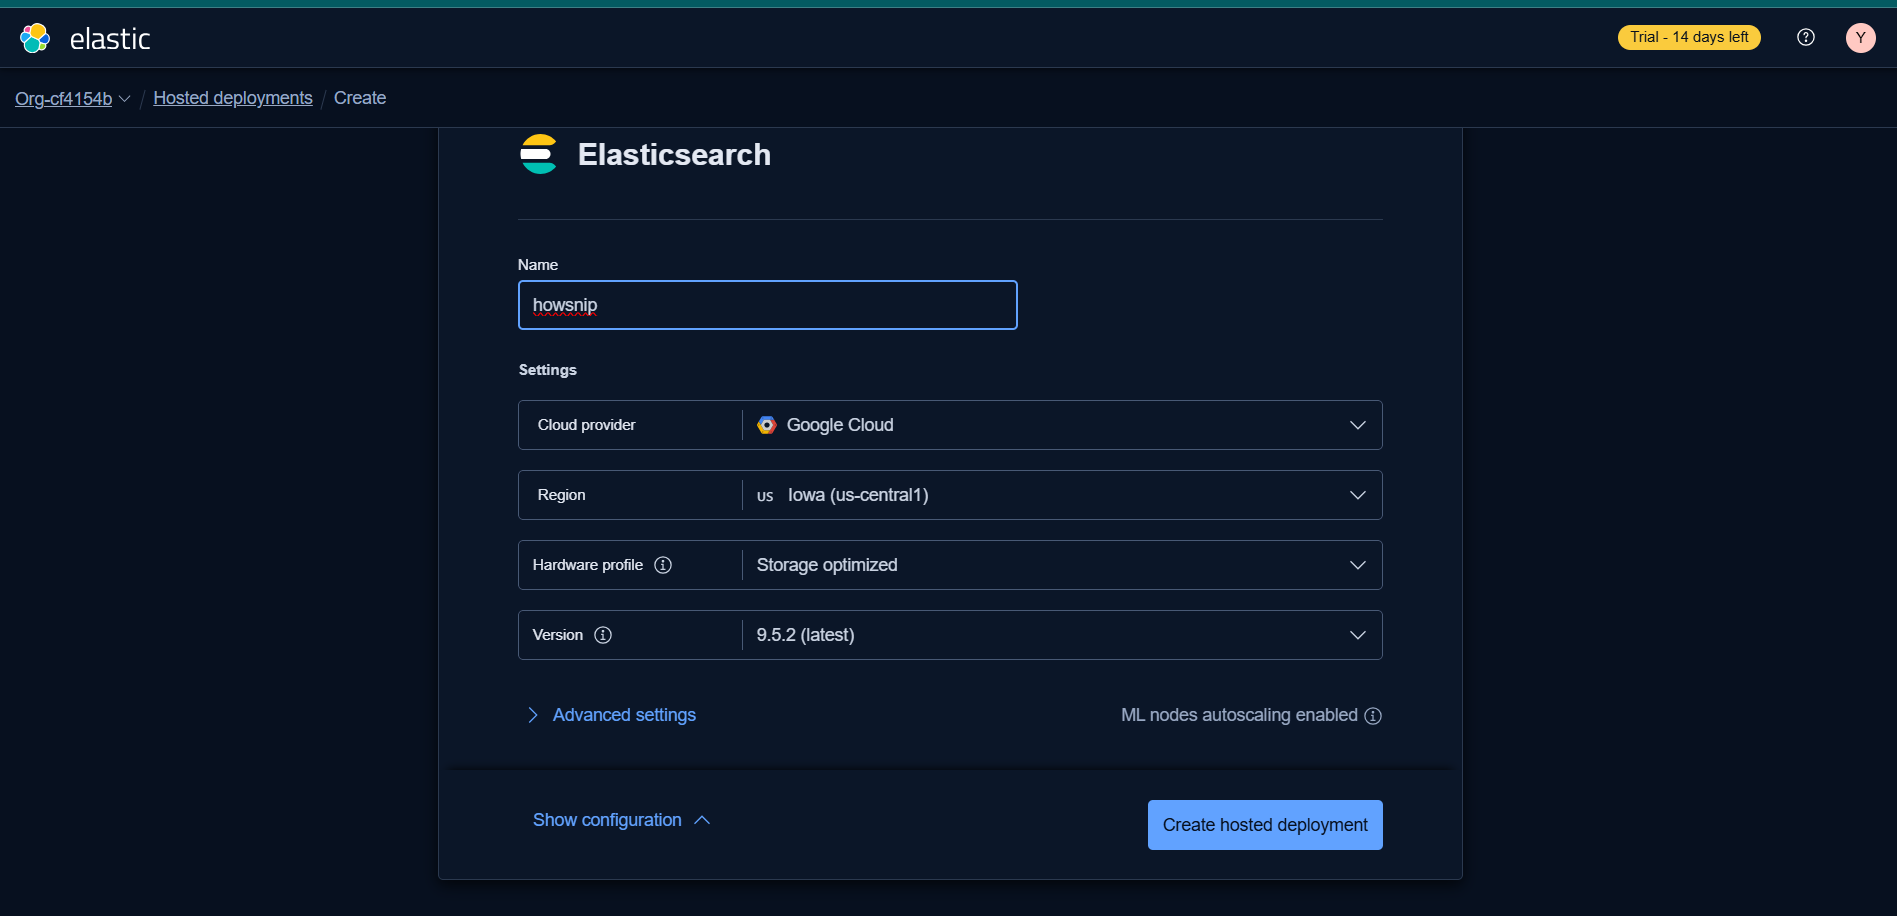
Accessing the Deployment
When deployment provisioning is complete, selecting Continue opens the newly created environment.
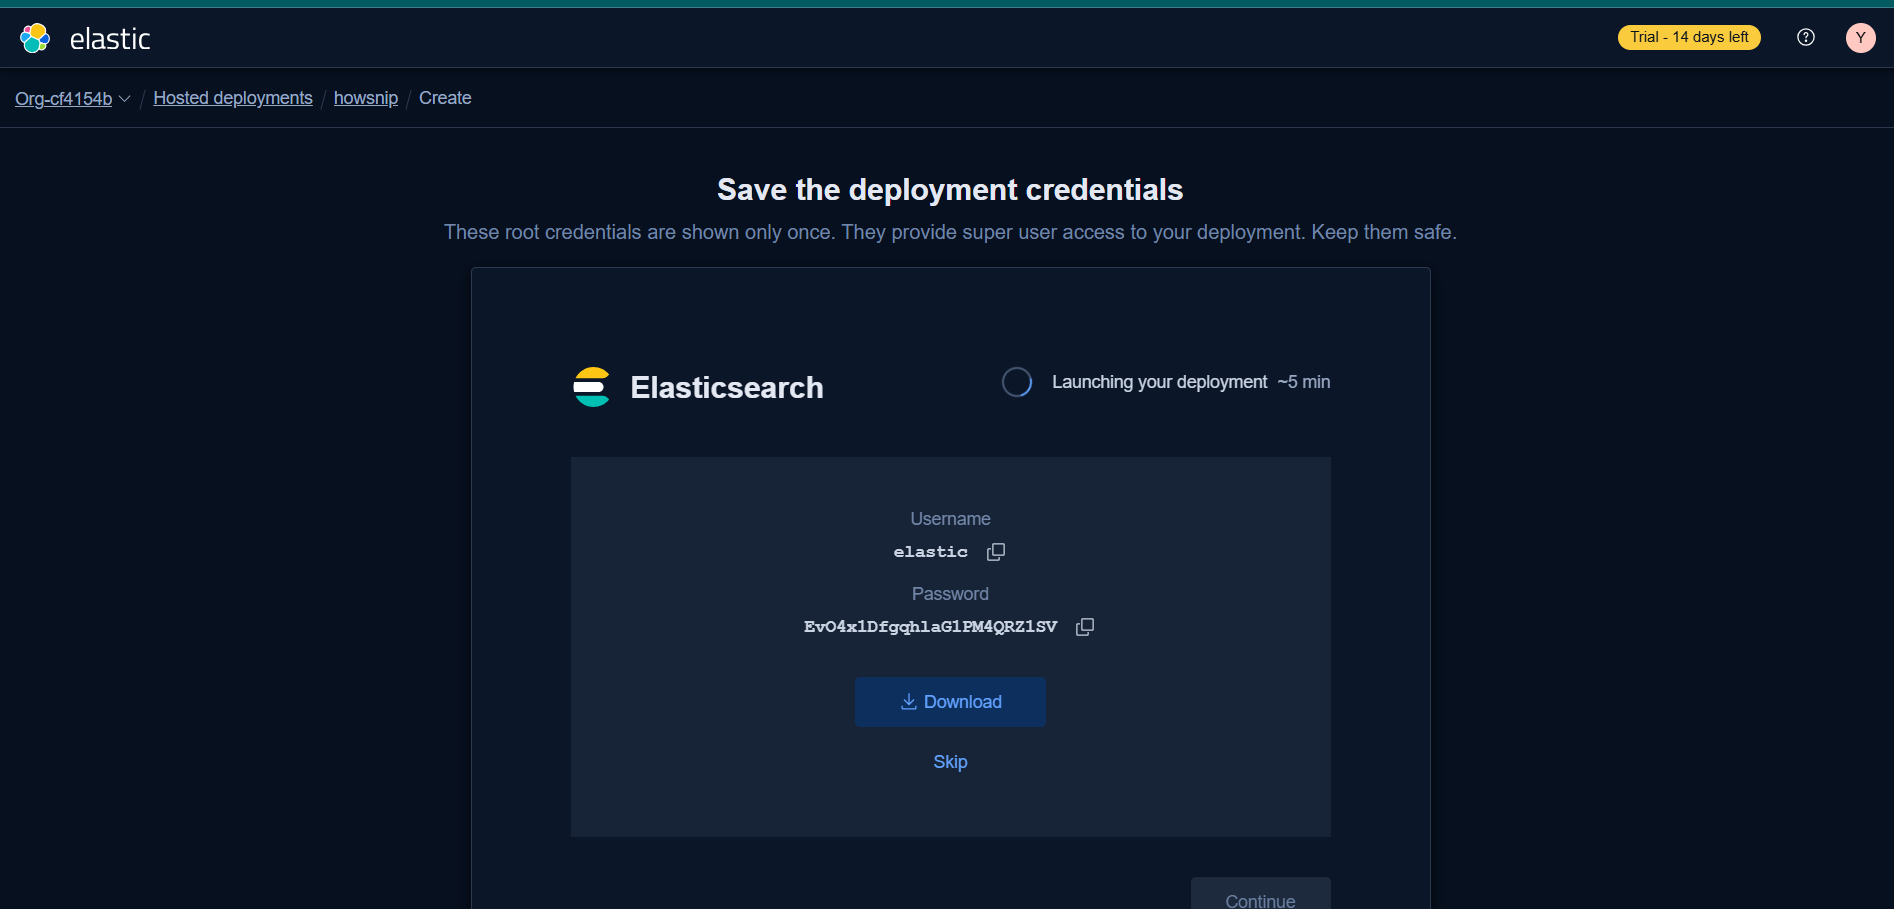
At this stage, the Elastic Cloud instance is ready for use, and Kibana can be accessed to begin configuring data collection, security monitoring, and analysis workflows.
2. Configuring Log Collection with Elastic Defend
A SIEM is only as useful as the data it receives. The next step is connecting a monitored system and enabling log collection.
Adding an Integration
Inside Kibana, navigate to the Integrations section and select Add Integration.
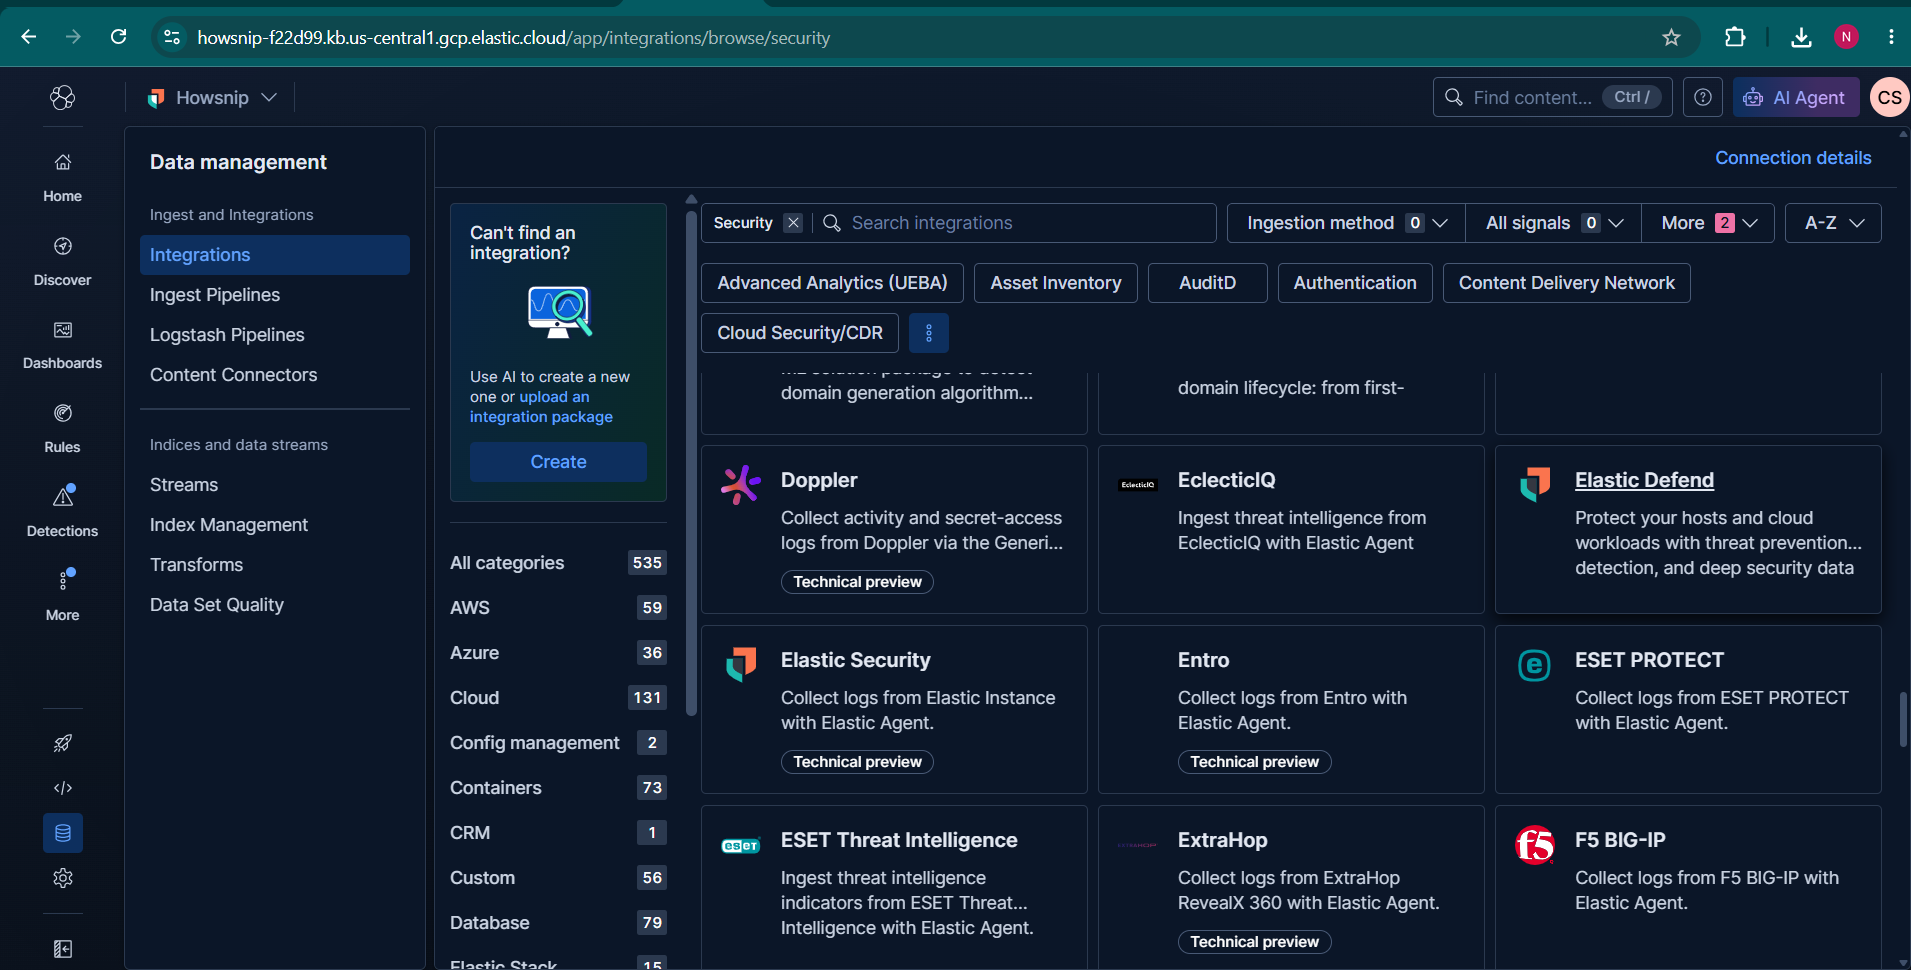
Integrations allow Elastic to collect and process data from various operating systems, services, applications, and security tools. For this lab, the goal is to monitor a Kali Linux virtual machine.
Selecting Elastic Defend
Search for and select Elastic Defend from the list of available integrations.
Elastic Defend provides endpoint visibility by collecting security and system events directly from monitored devices. These events are then forwarded to Elasticsearch for analysis.
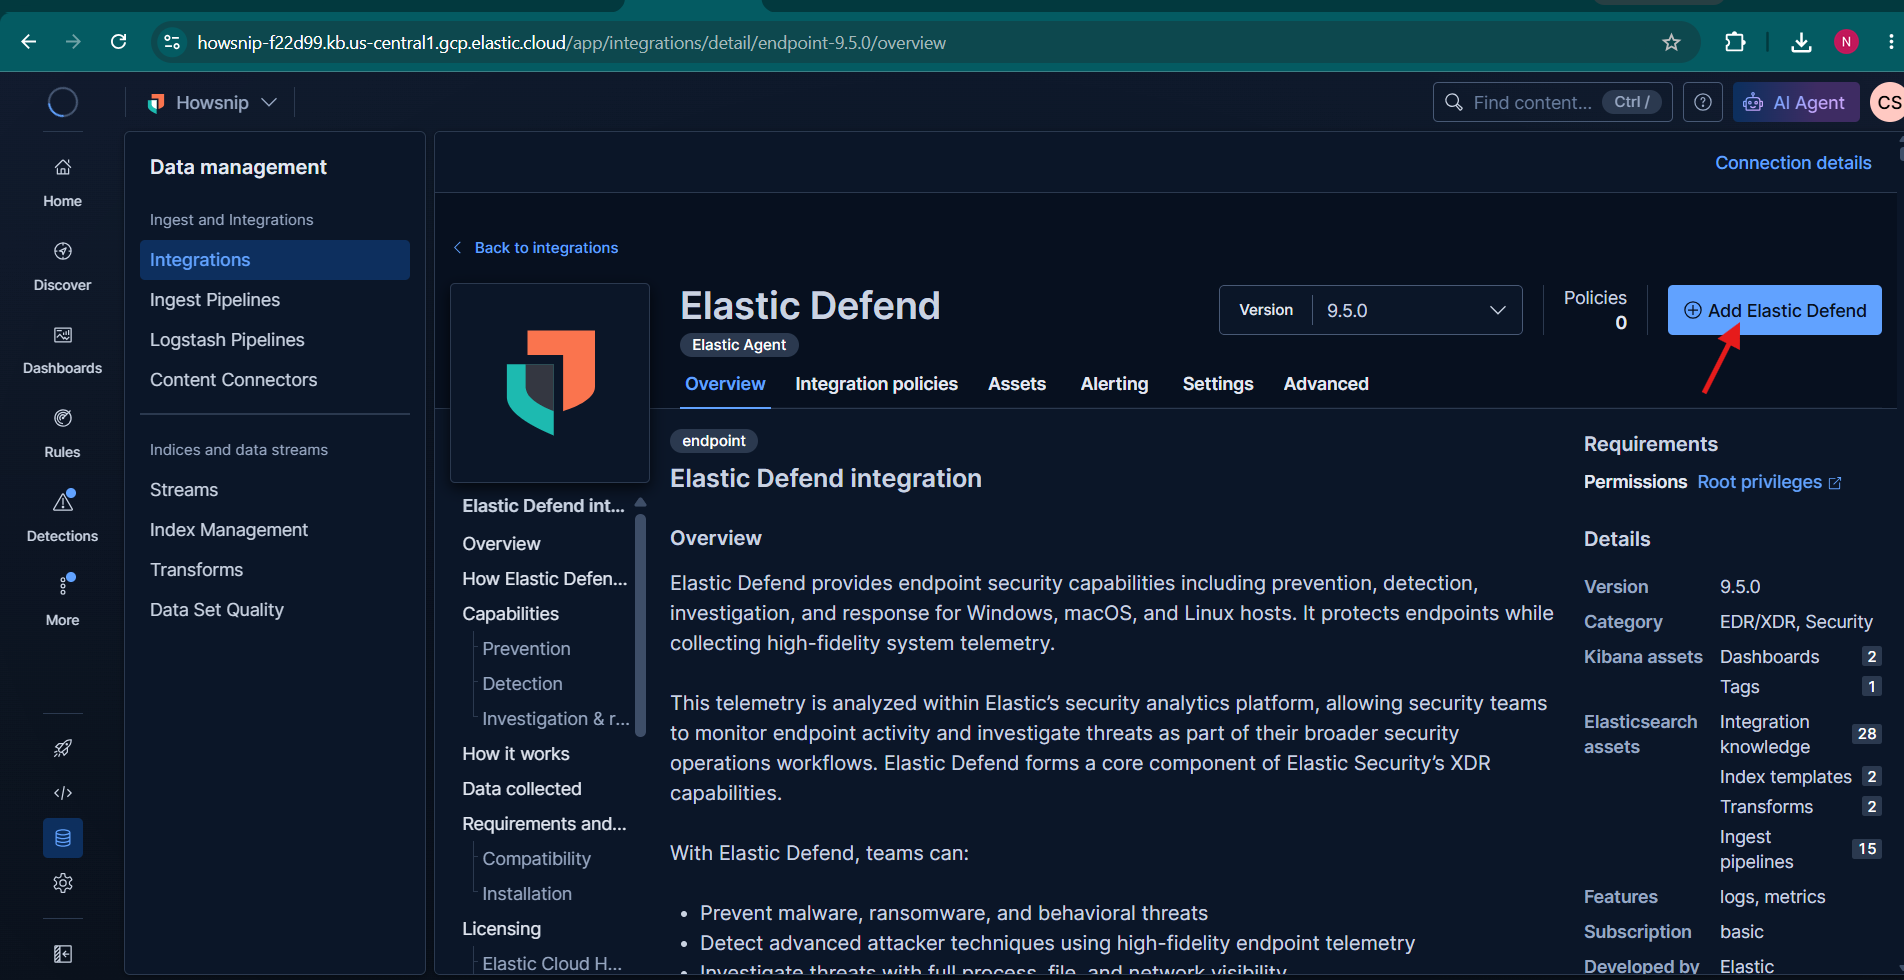
Creating the Integration Policy
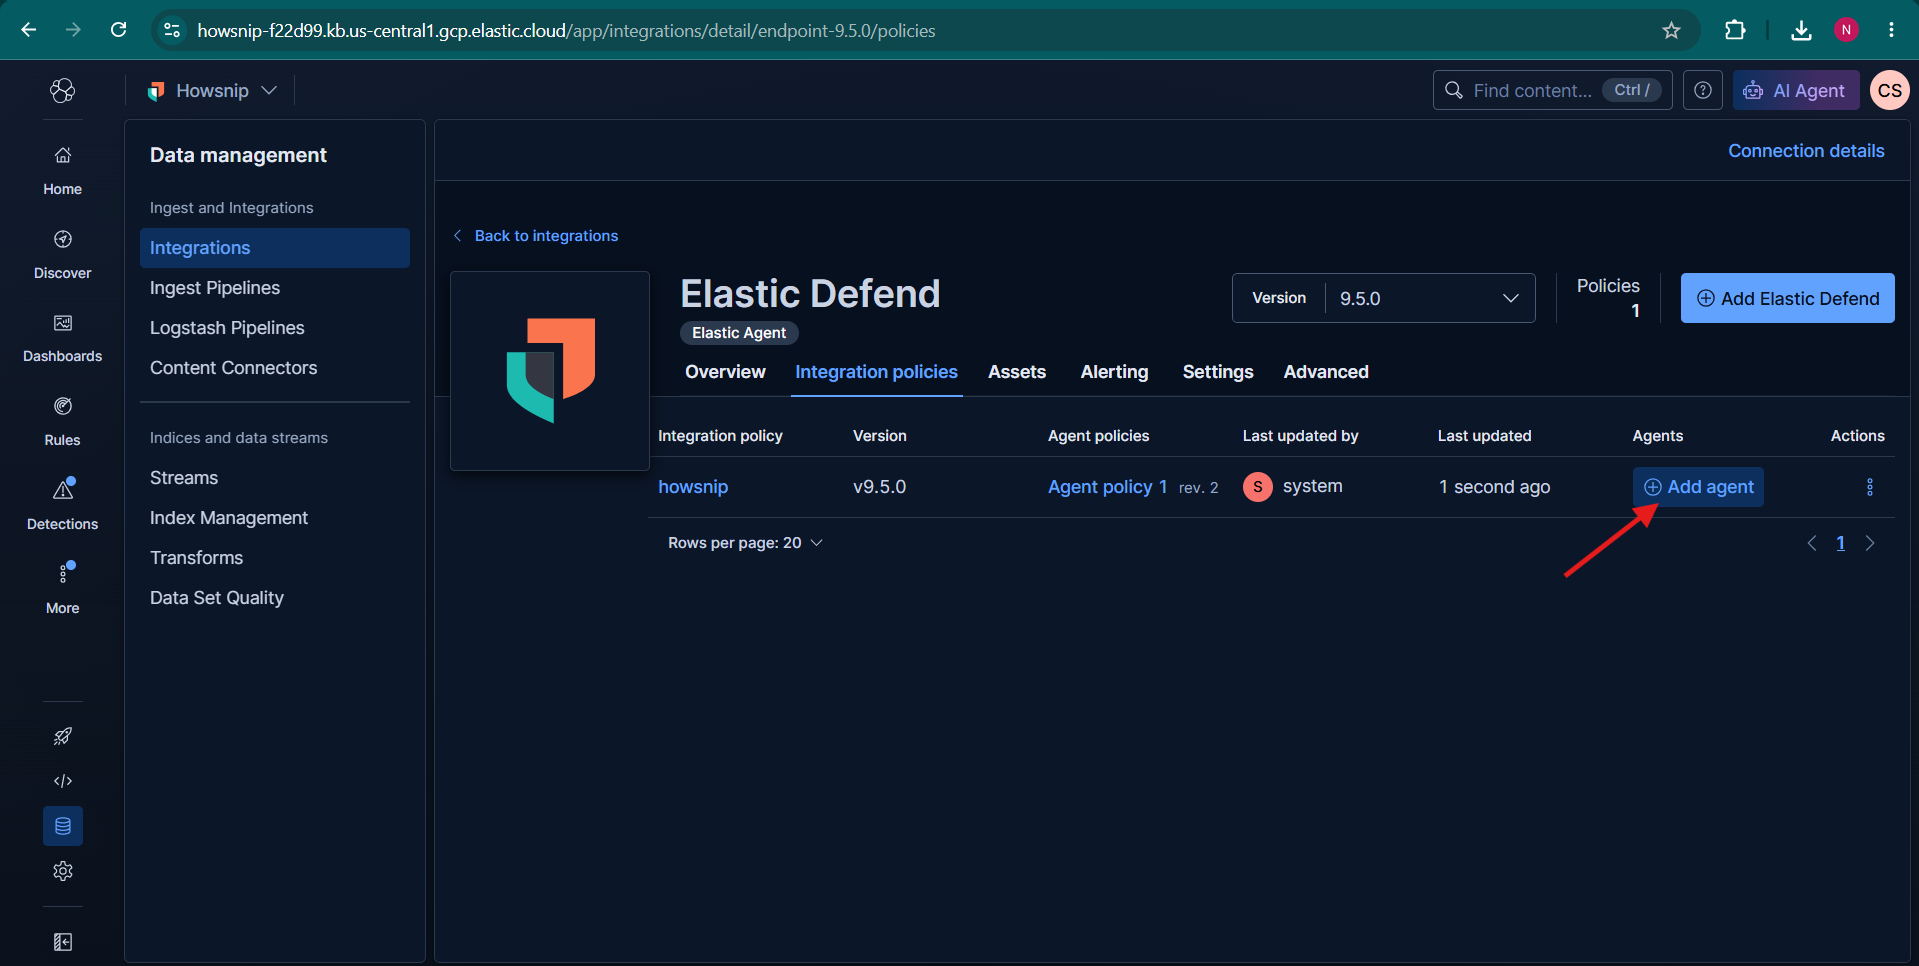
After opening Elastic Defend, click Add Elastic Defend to begin configuration. This process creates an Elastic Agent policy that defines how endpoint data will be collected and sent to the Elastic Cloud environment.
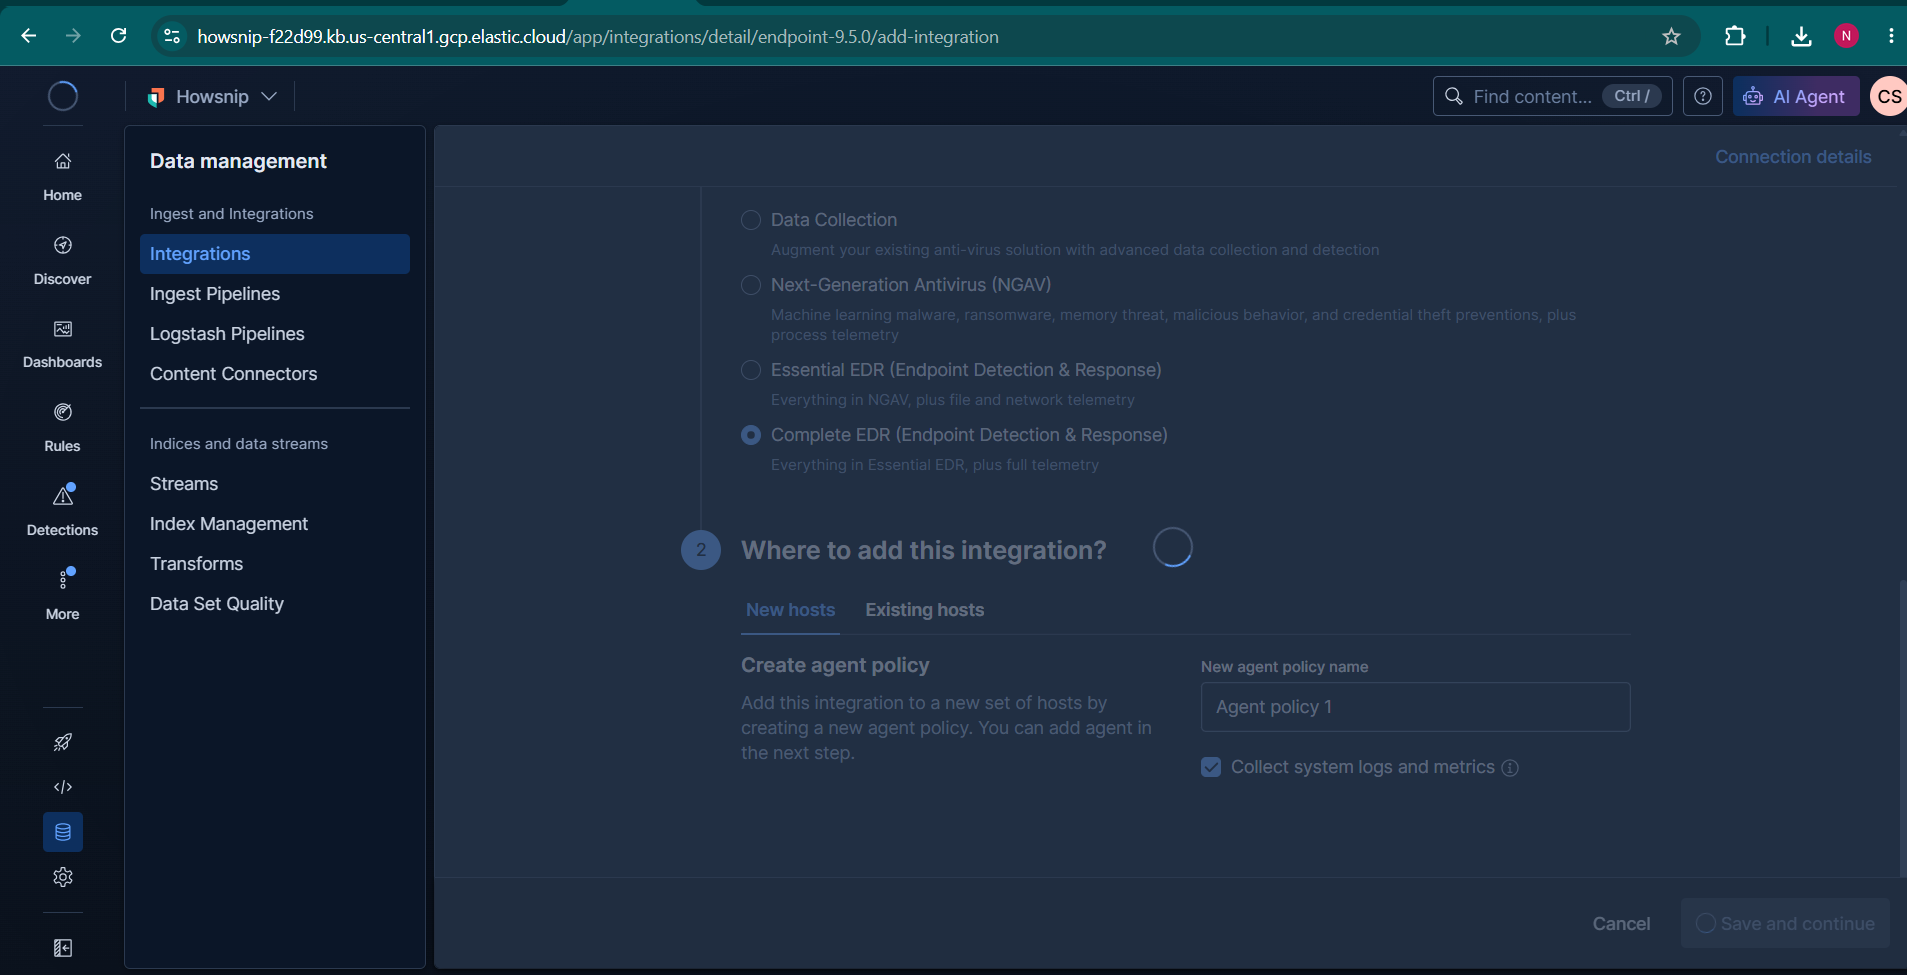
3. Installing Elastic Agent on Kali Linux
With Elastic Defend configured, the next task is installing the Elastic Agent on the endpoint.
Obtaining the Installation Command
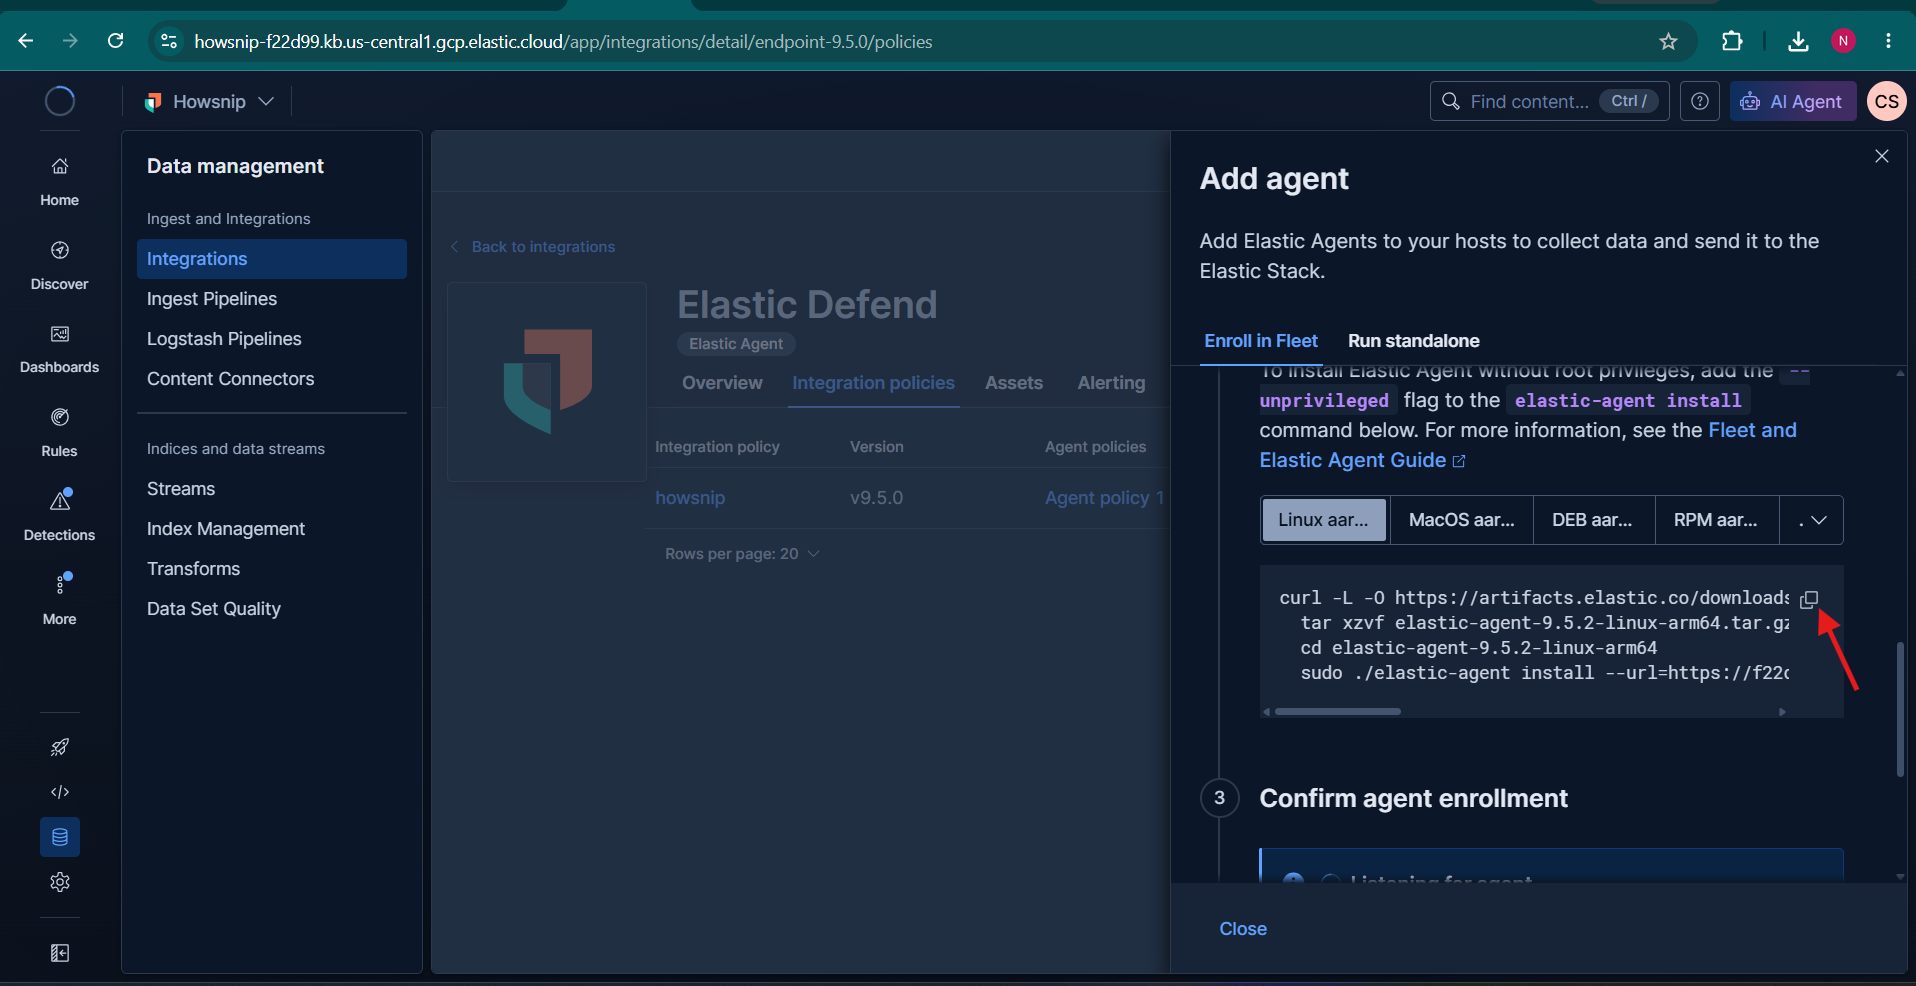
Choose Install Elastic Agent and select Linux TAR as the installation method.
Elastic generates a unique installation command containing the enrollment information required for the agent to connect securely to the deployment.
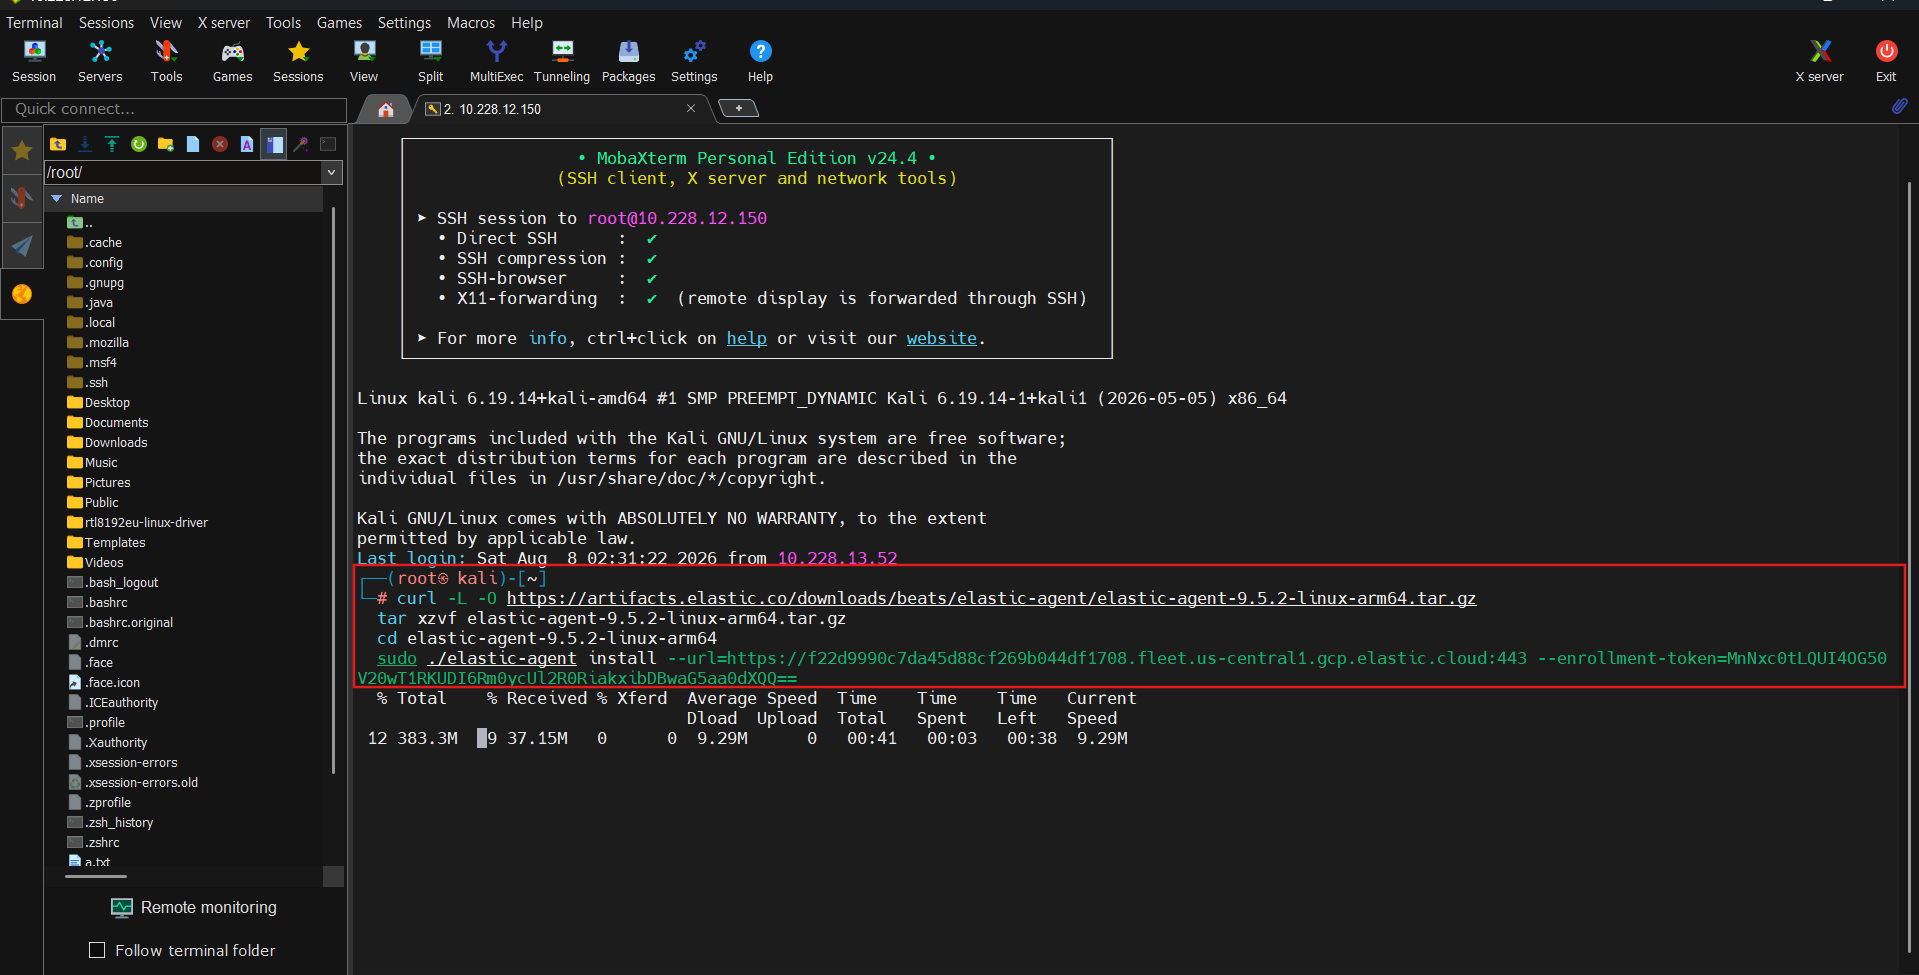
Deploying the Agent
Open a terminal on the Kali Linux virtual machine and execute the installation command provided by Elastic. The installation process deploys the Elastic Agent and automatically enrolls it with the Elastic Cloud environment.
Verifying Connectivity
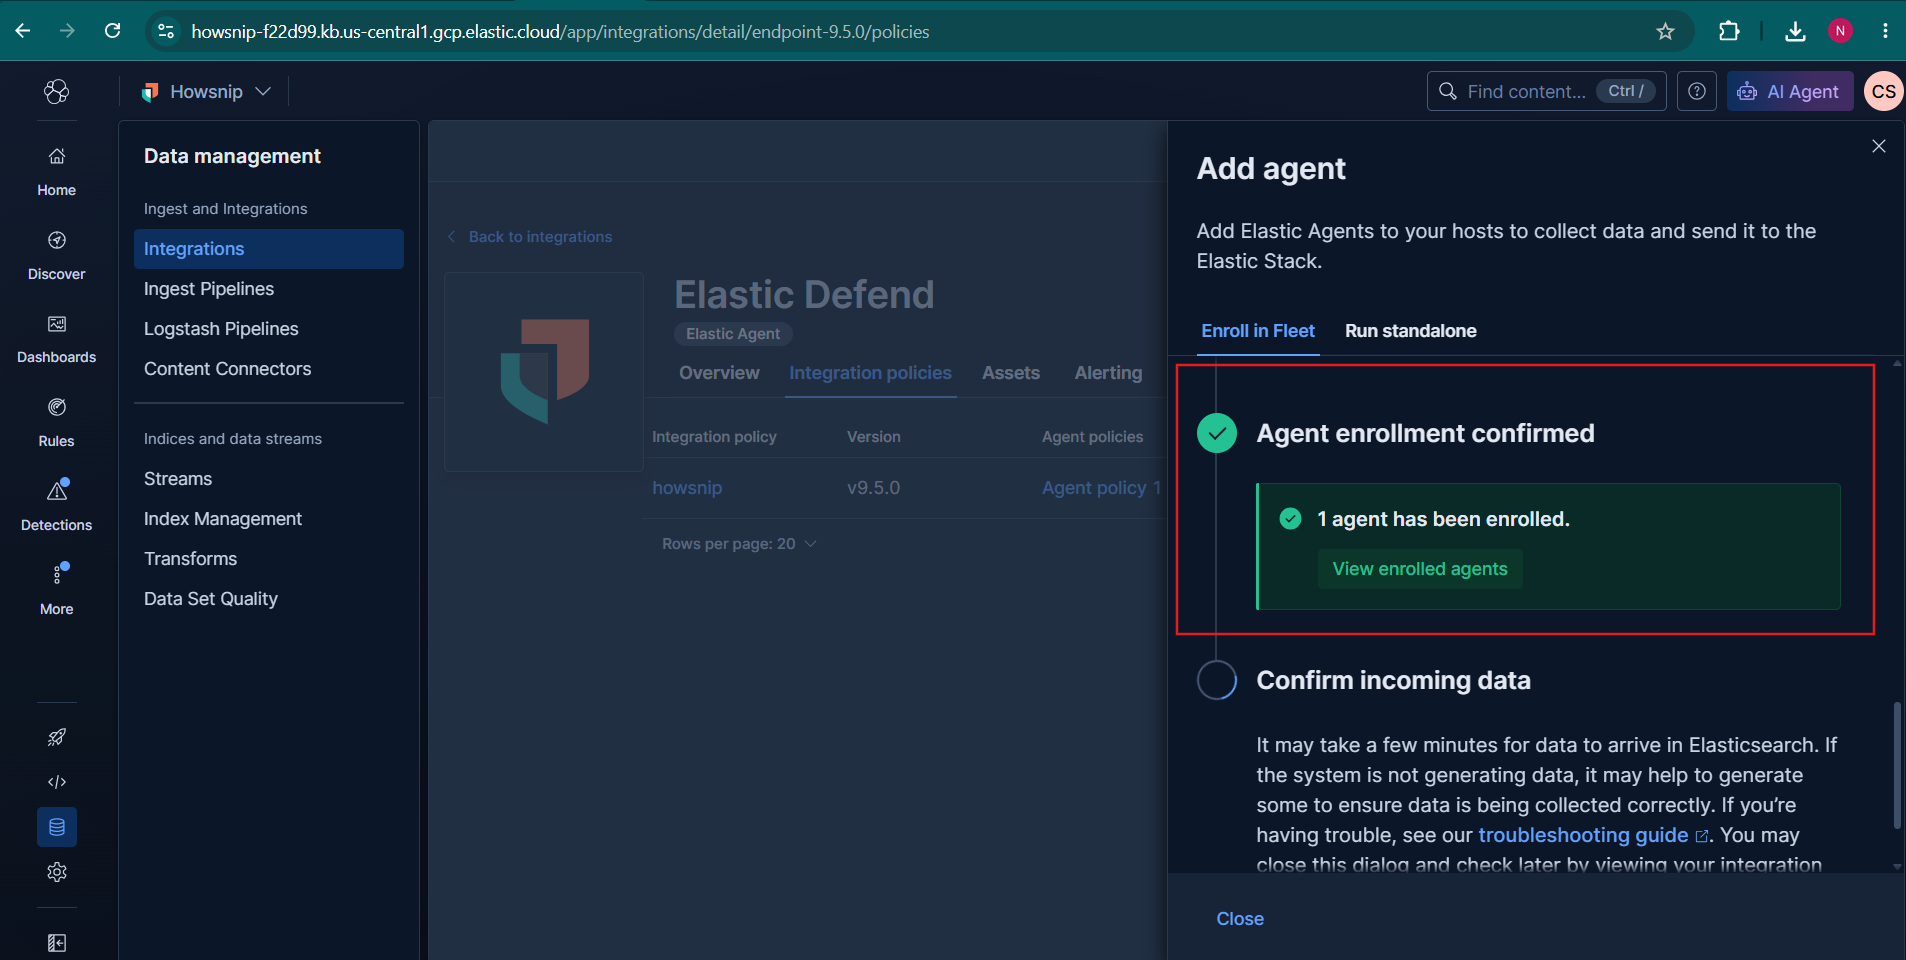
After installation completes, verify that the agent appears as connected within Elastic.
A successful connection confirms that the Kali Linux system is actively forwarding logs and security telemetry to the SIEM platform, making the data available for monitoring and investigation.
4. Exploring and Analyzing Security Events
Once data begins arriving, Elastic can be used to search, filter, and analyze events generated by the monitored system.
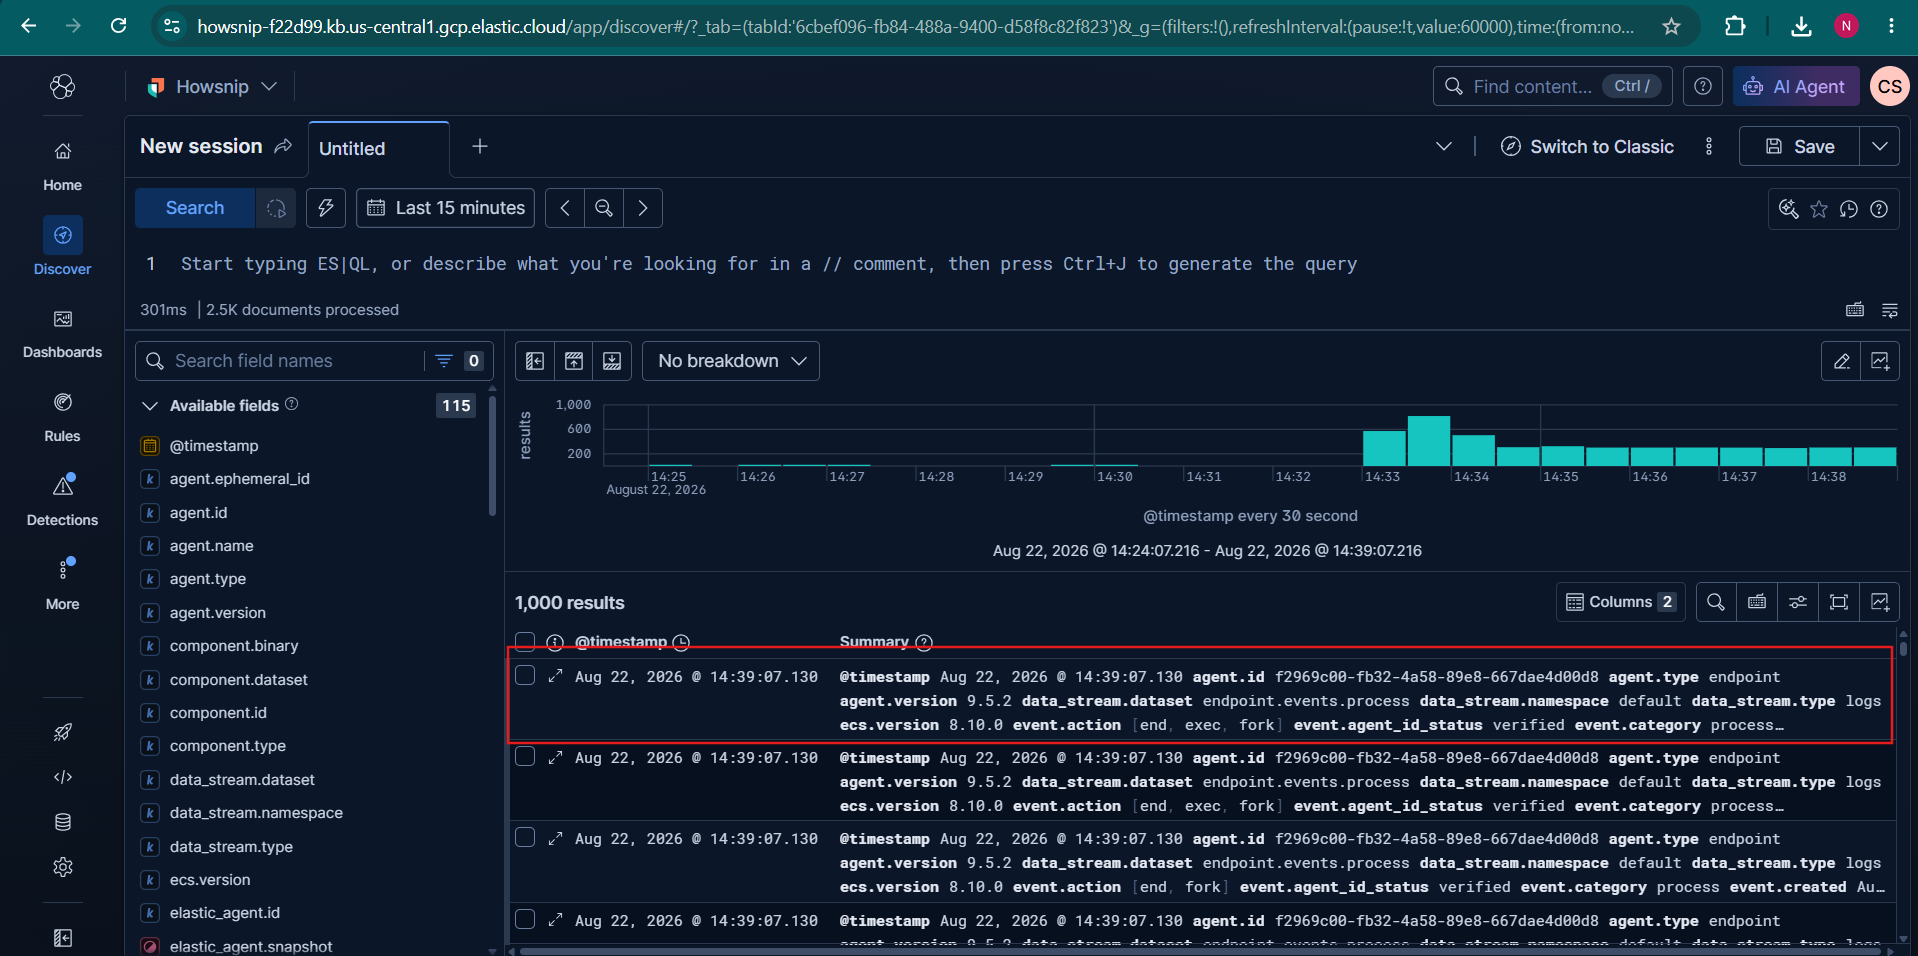
Reviewing Collected Logs
Open the Logs section in Kibana to view incoming events. This area provides visibility into operating system activities, security events, and other telemetry collected from the Kali Linux machine.
Filtering Events by Host
To isolate logs from a specific device, a filter can be created using the host IP address:
FROM logs-* | WHERE KQL("host.ip":"10.228.12.150")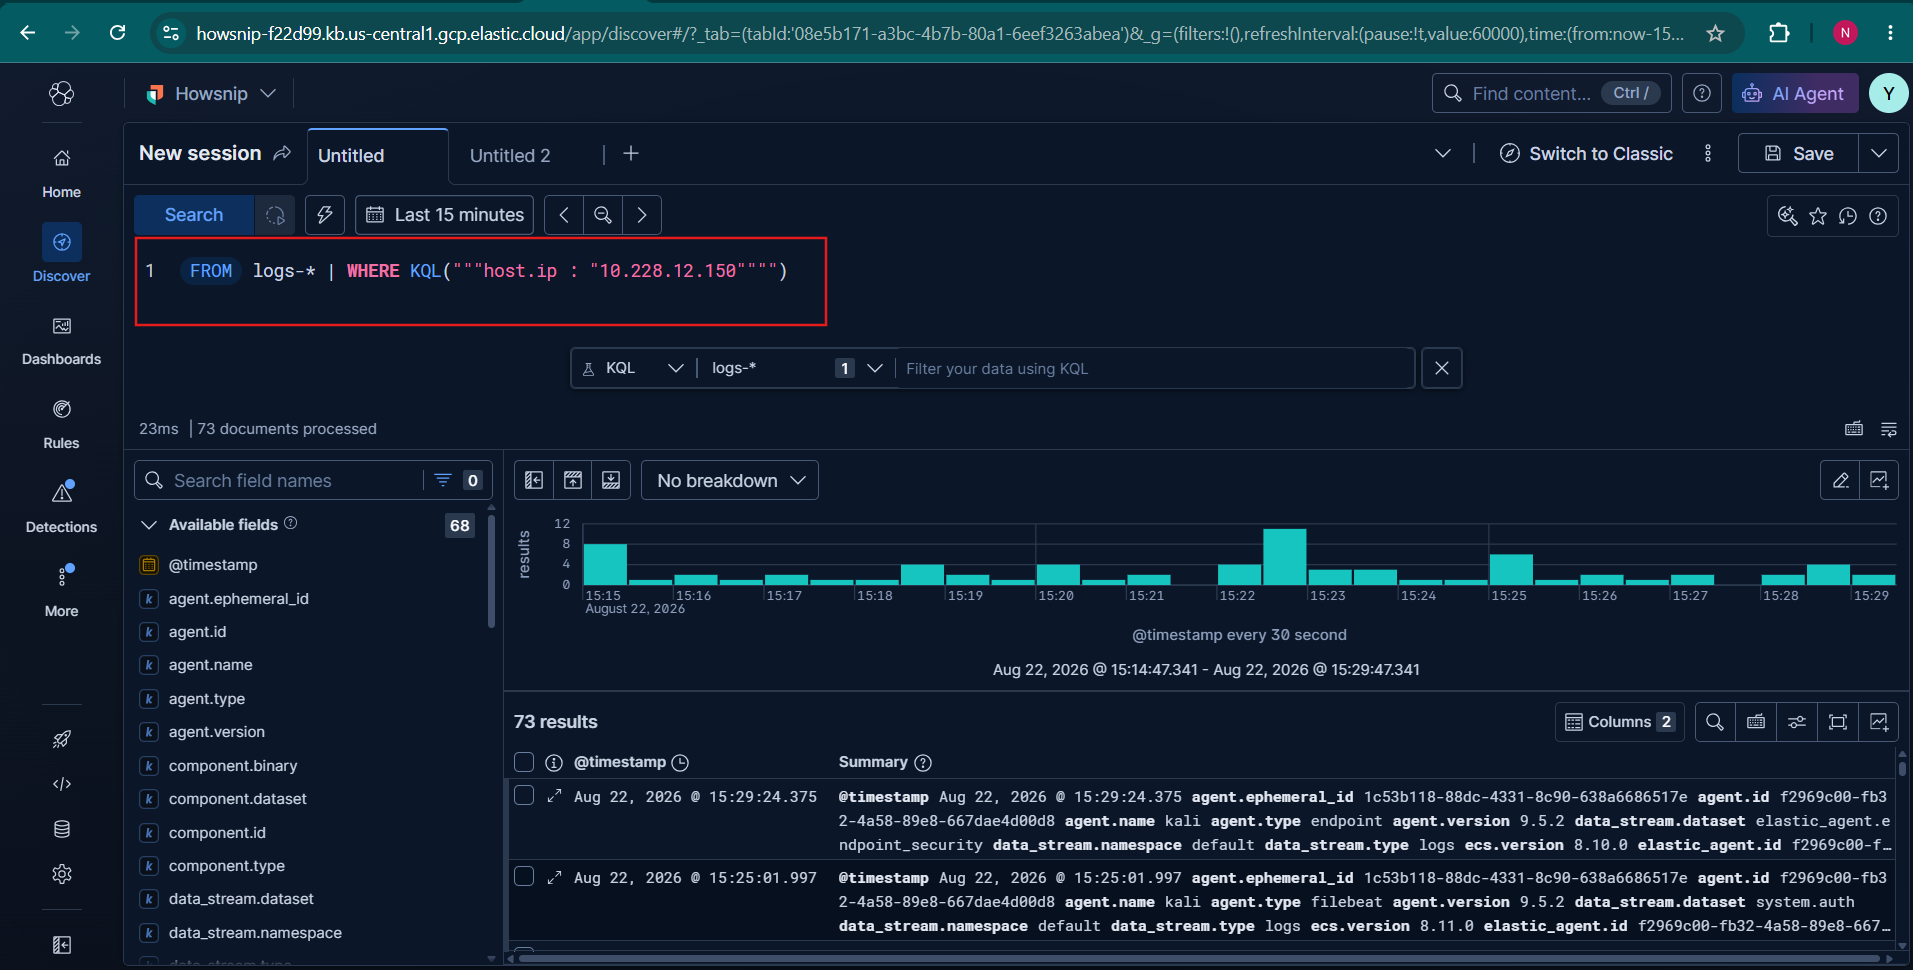
This query searches the logs-* index pattern and returns only events associated with the specified IP address. Filtering logs in this way reduces noise and allows analysts to focus on activity from a particular system.
5. Building a SIEM Dashboard
Dashboards transform raw log data into visual insights that are easier to understand and monitor.
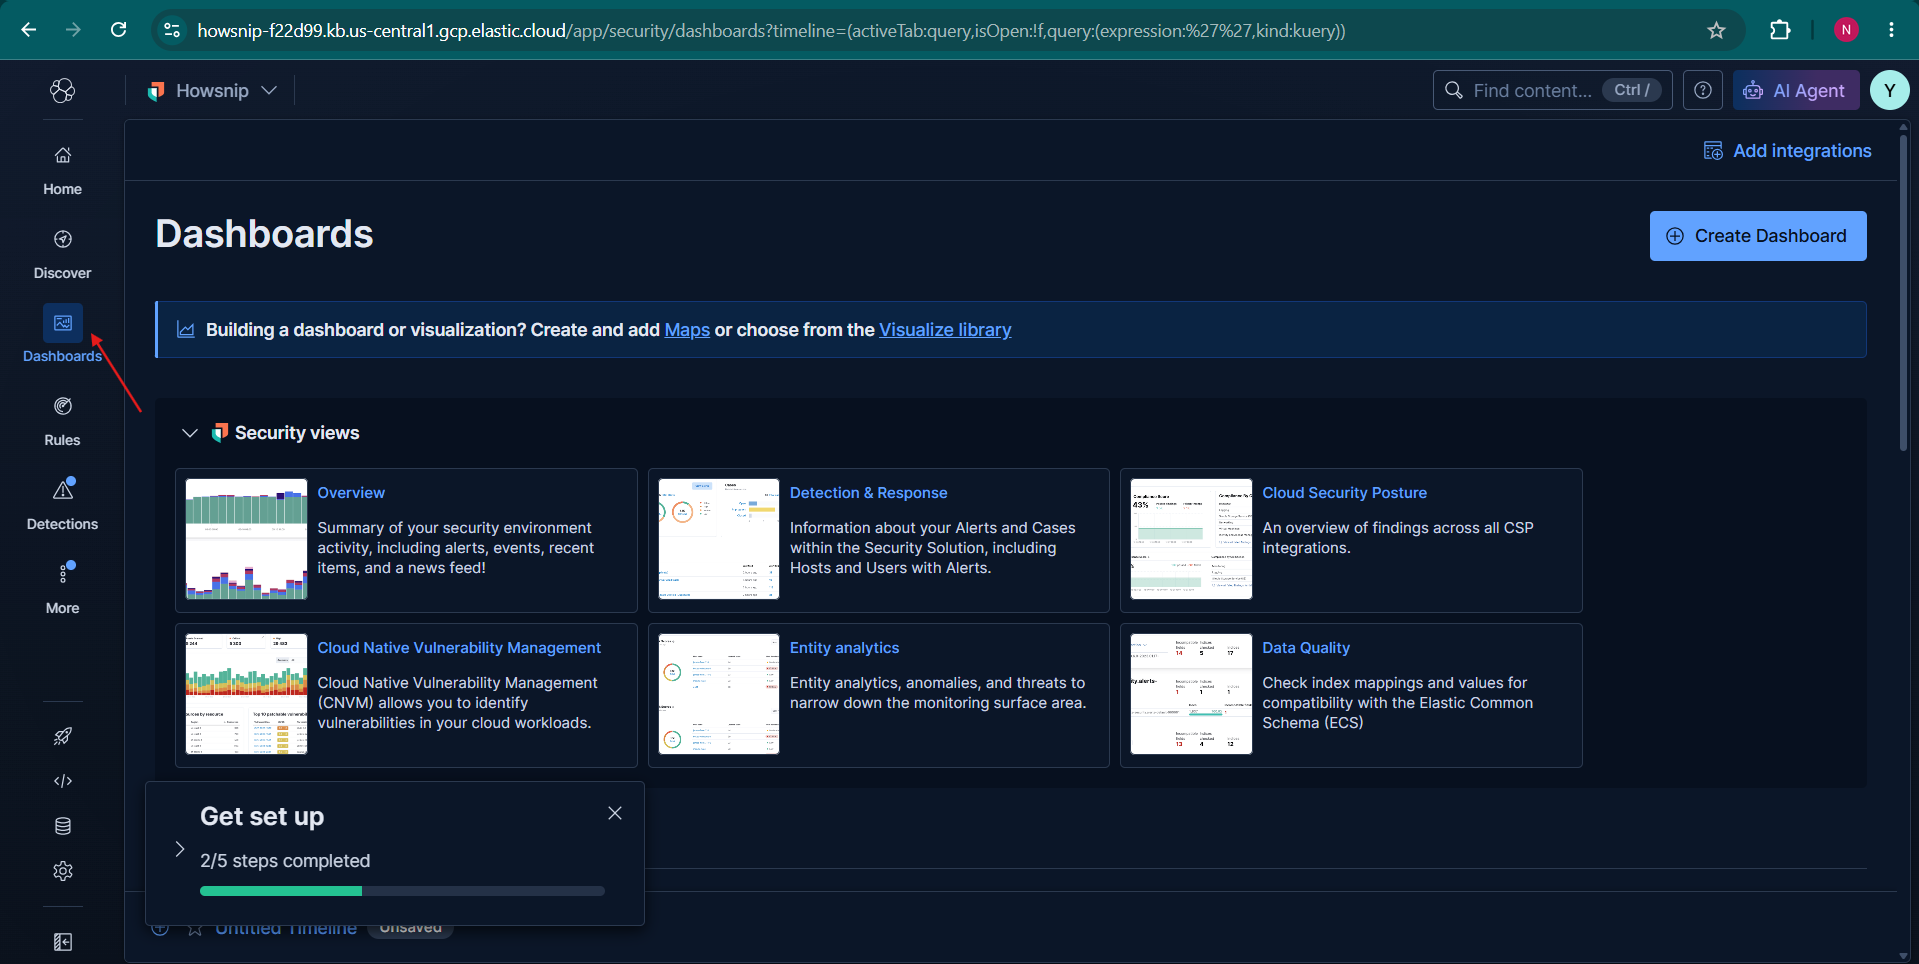
Creating a Dashboard
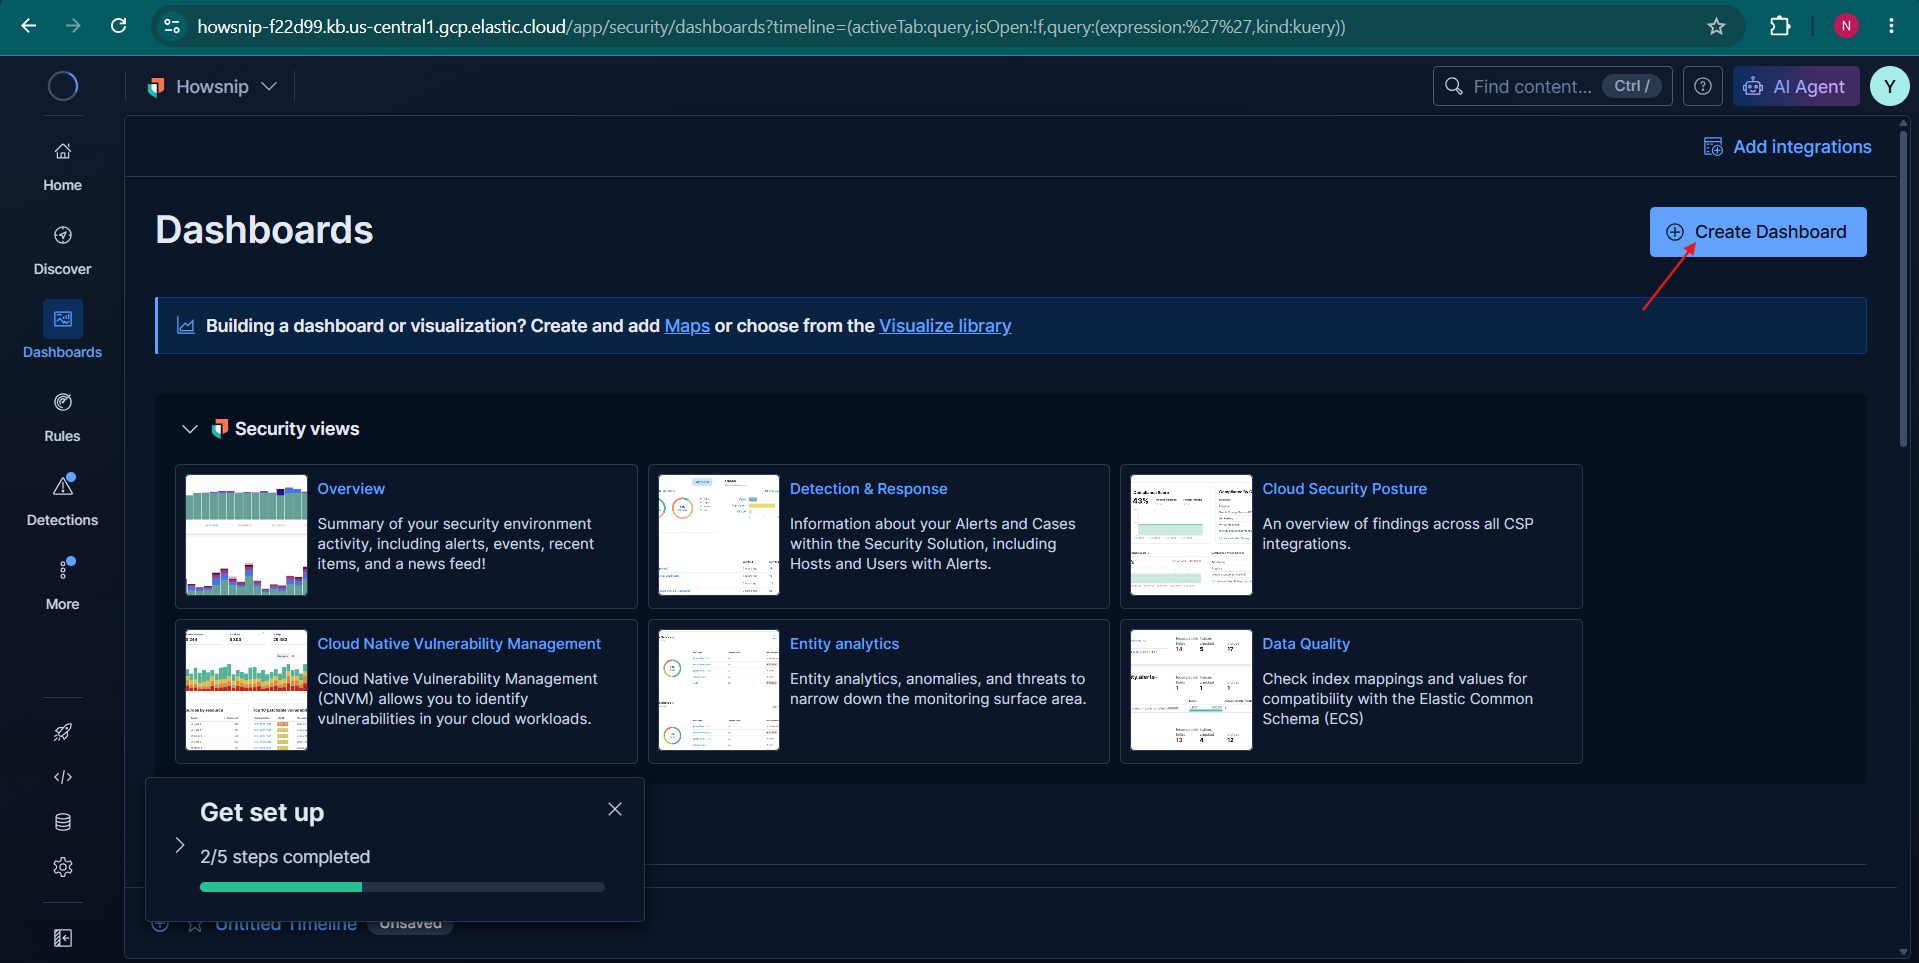
After reviewing collected logs, create a new dashboard in Kibana. Dashboards provide a centralized view of security and operational data, allowing important trends and events to be monitored at a glance.
Adding Visualizations
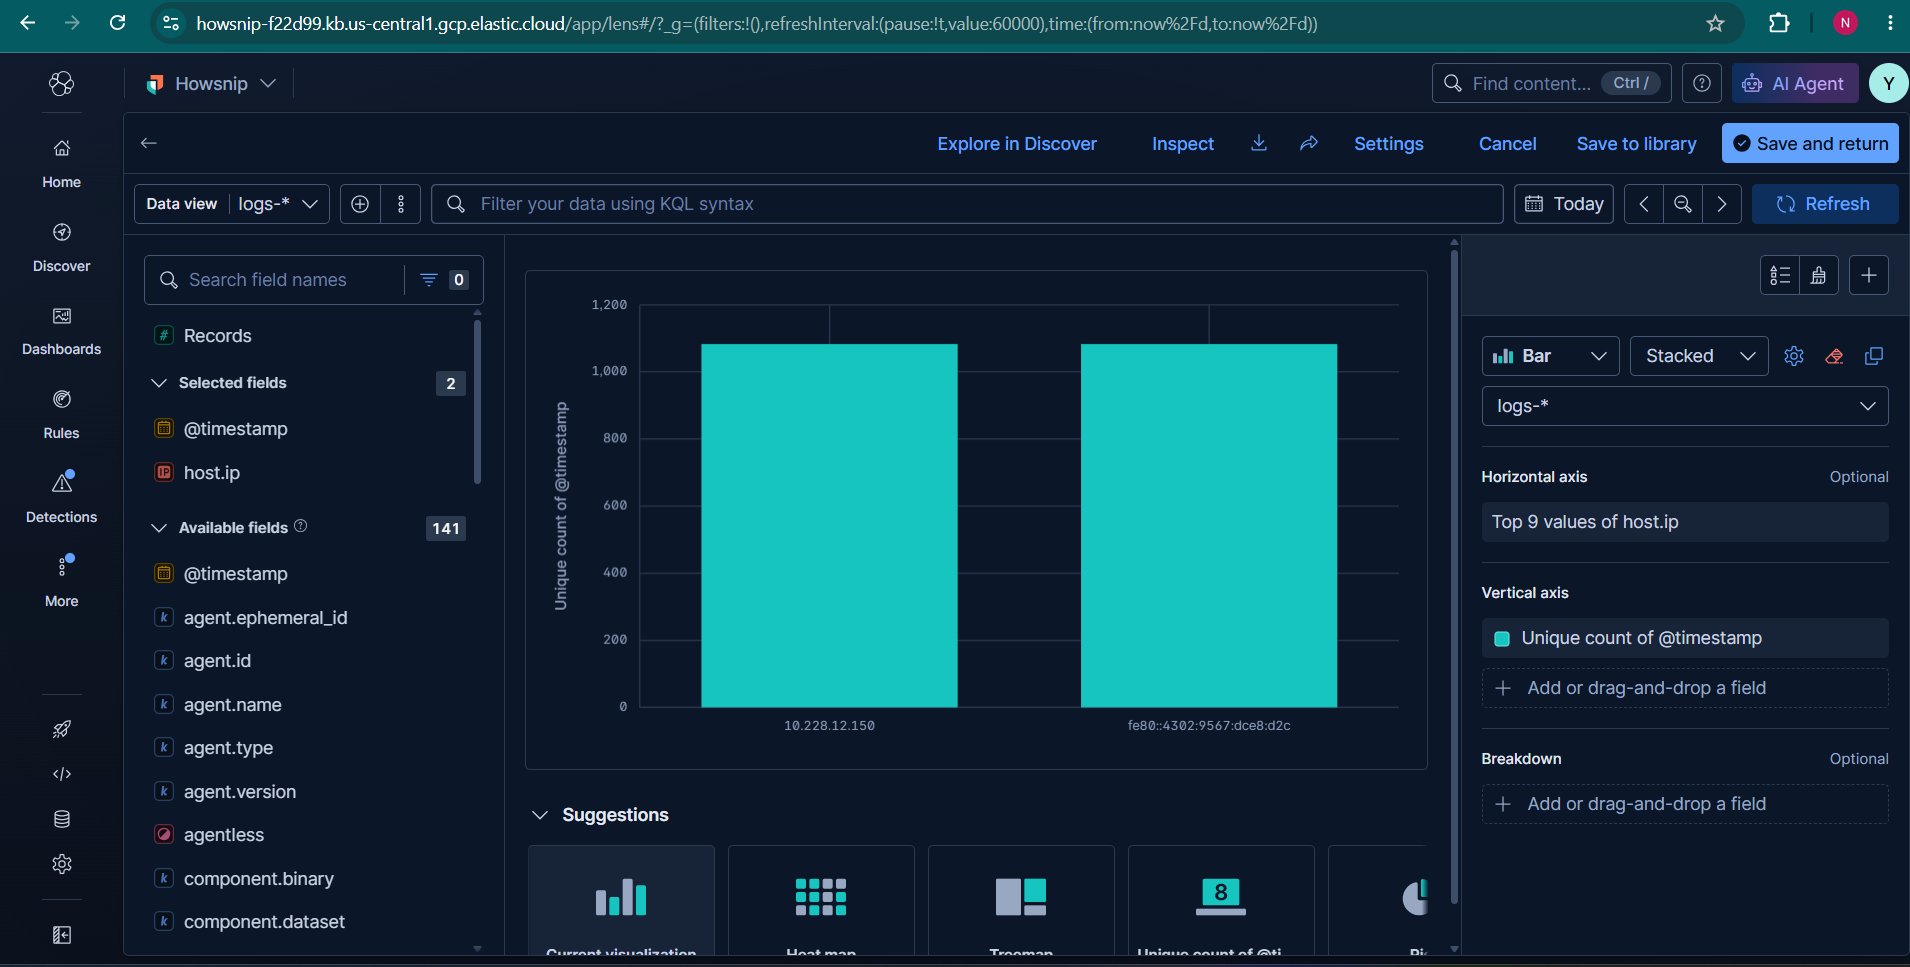
A useful starting visualization is a chart showing the number of security events over time.
This type of visualization helps identify:
- Activity spikes
- Event trends
- Periods of unusual behavior
- Changes in system activity
Rather than scrolling through individual log entries, visualizations provide a higher-level view of what’s happening across the monitored environment.
Monitoring Security Activity
After adding visualizations to the dashboard, the dashboard becomes a central monitoring workspace. It offers a consolidated view of the security events being collected from the Kali Linux system and helps streamline ongoing analysis.
6. Creating a Detection Rule for Failed SSH Logins
One of the core functions of a SIEM is identifying suspicious behavior and generating alerts. To demonstrate this capability, a custom detection rule can be created to identify failed SSH authentication attempts.
Creating a Custom Query Rule
Navigate to the detection rules section and select Create Rule.
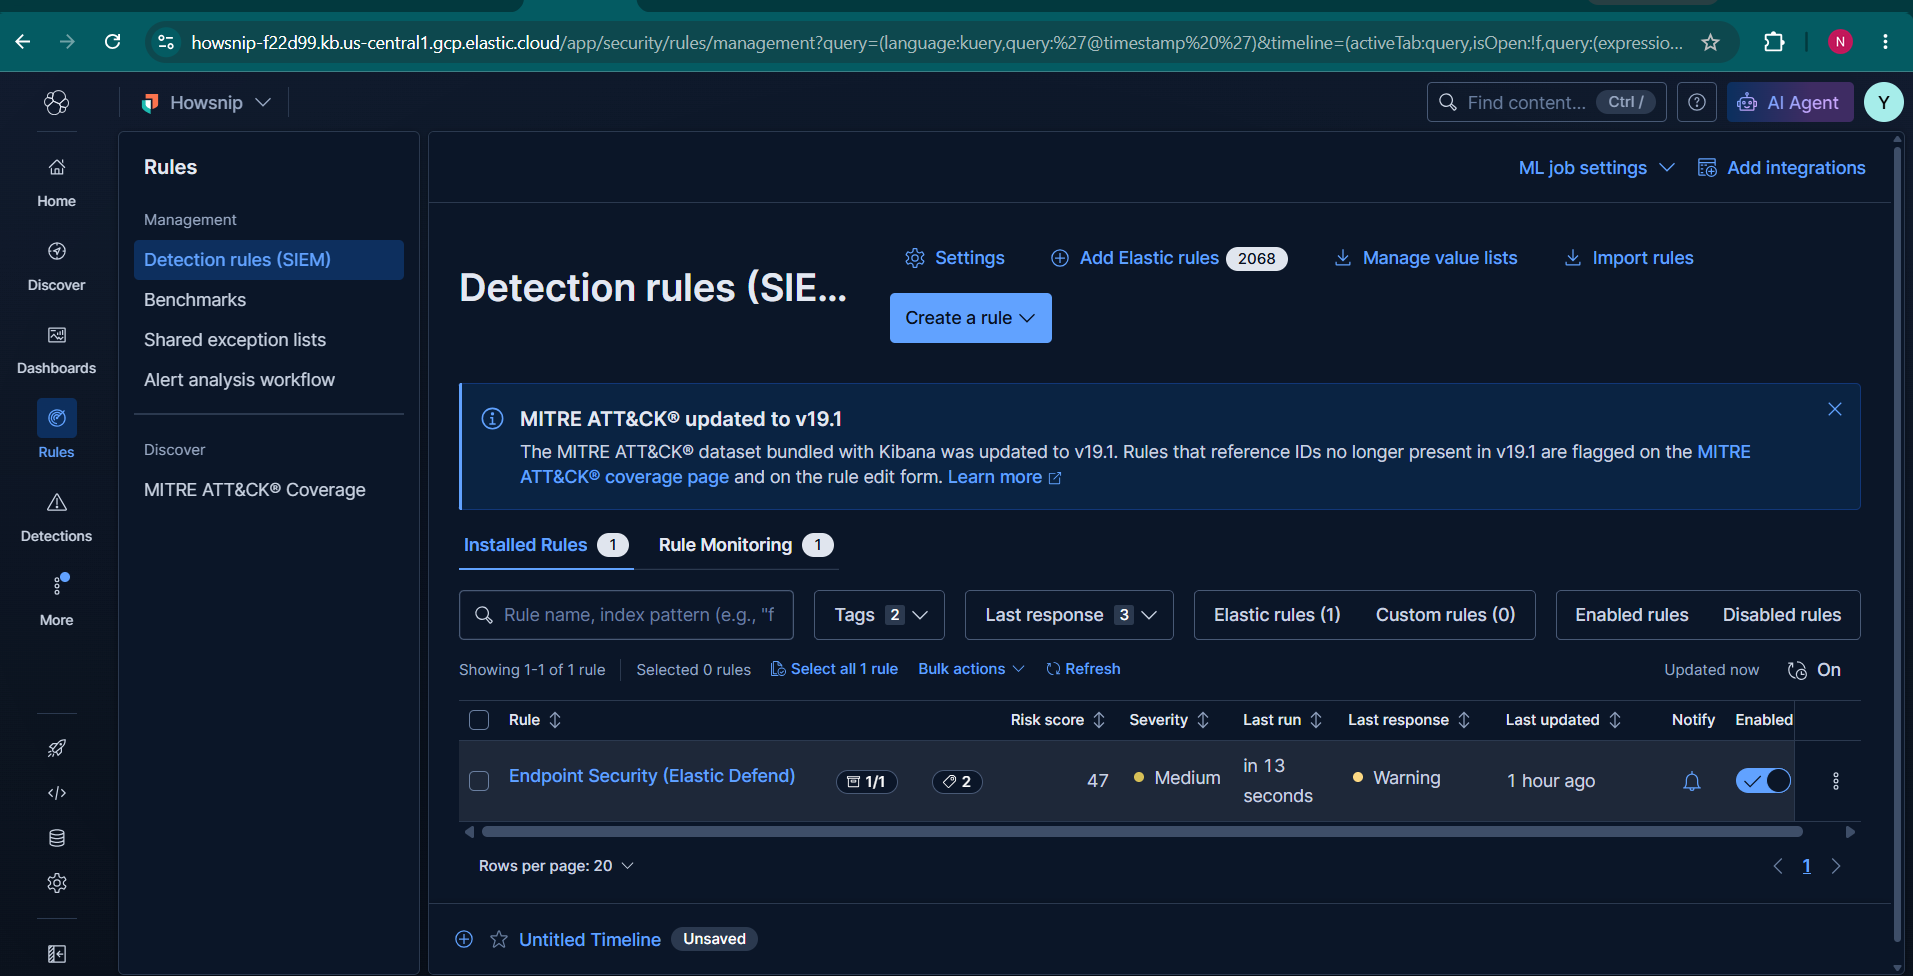
Choose Custom Query as the rule type.
This option allows you to define custom detection logic based on specific events stored within Elasticsearch.
Defining the Detection Logic
Select the appropriate data indices and enter the following query:
event.category:"authentication" and event.outcome:"failure" and process.name:"sshd"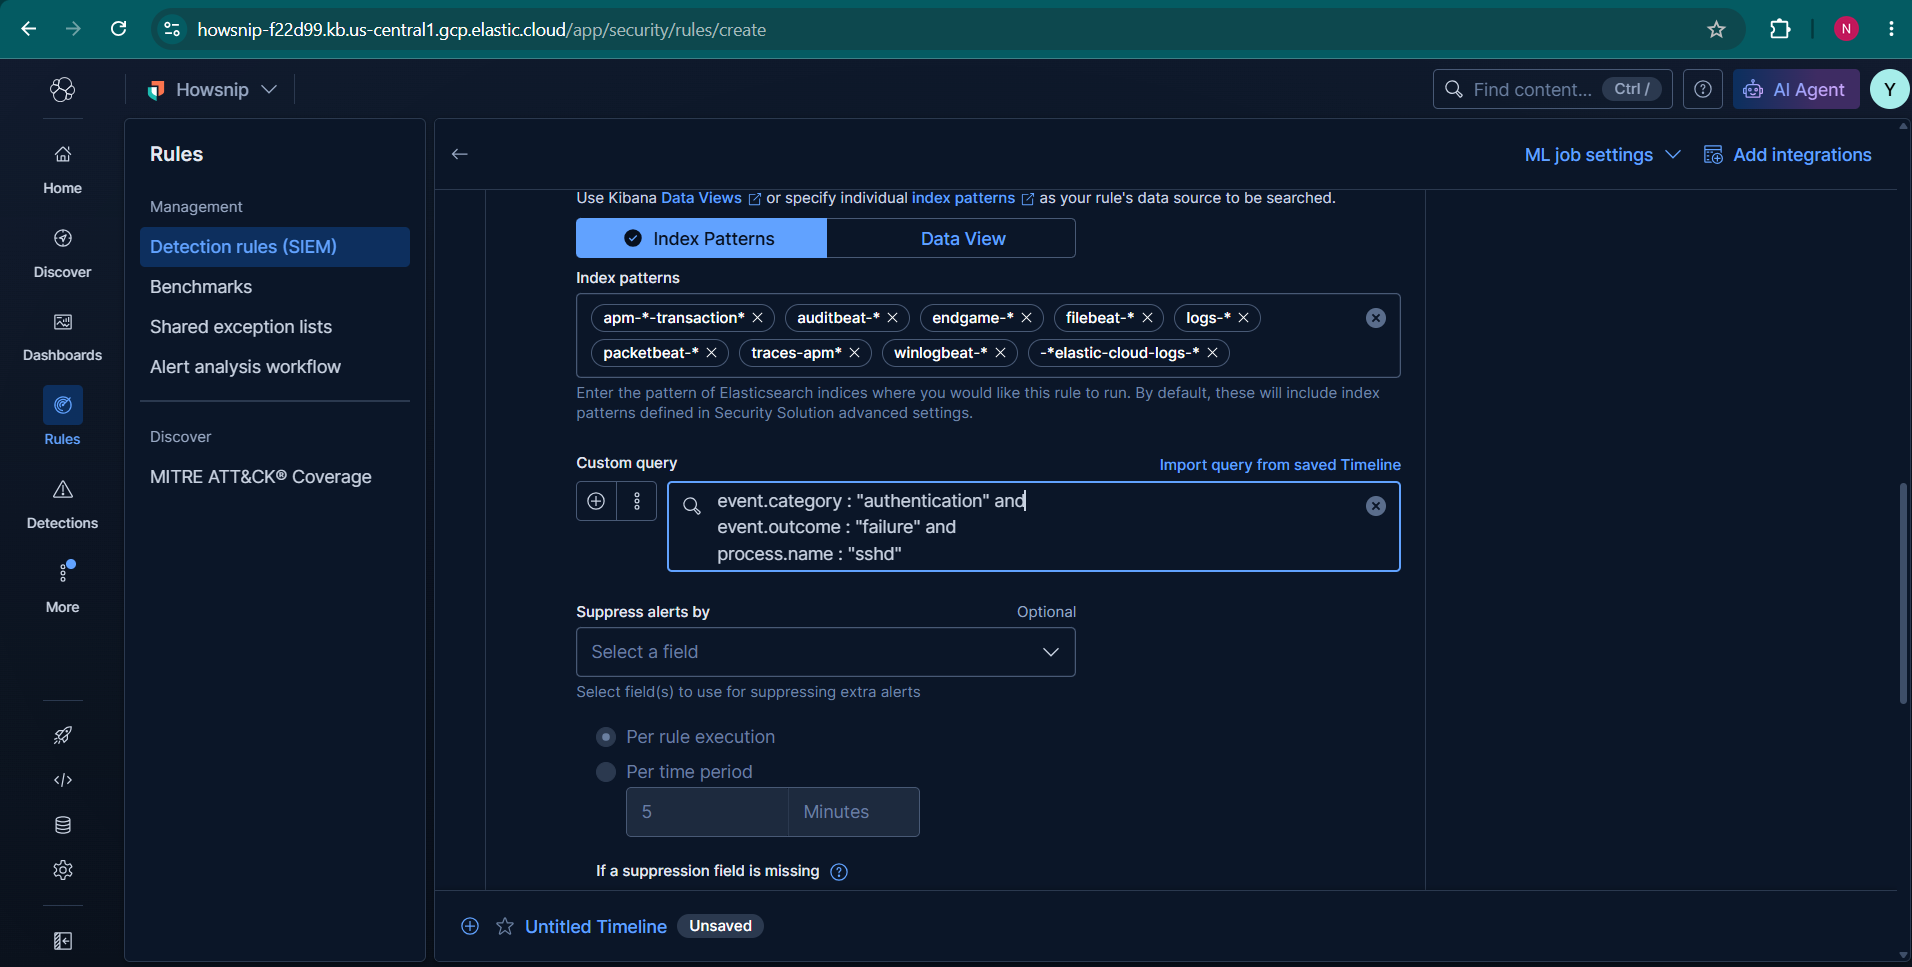
This query searches for authentication events where the login attempt failed and the associated process was sshd.
Such events are commonly associated with unsuccessful SSH login attempts and can be useful for identifying unauthorized access attempts or brute-force activity.
Configuring Rule Details
The rule can be configured with the following settings:
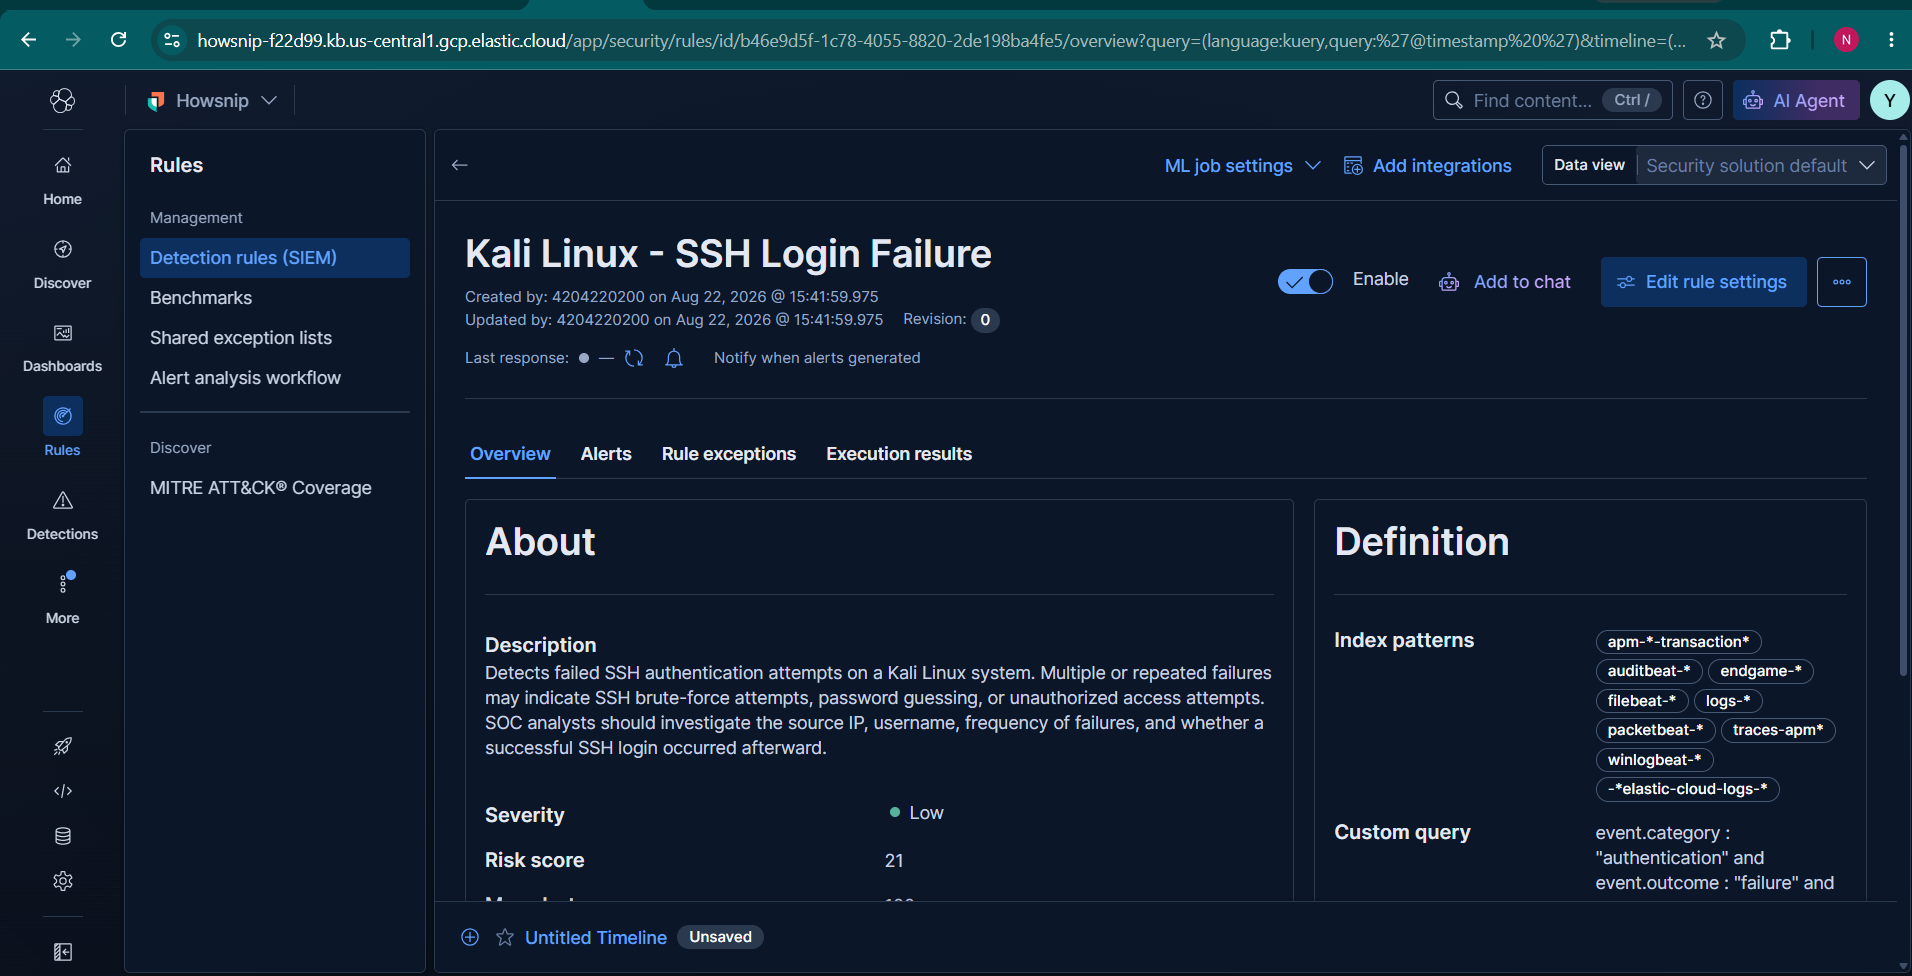
- Rule Name: Kali Linux – SSH Login Failure
- Detection Type: Custom Query
- Severity: Low
- Risk Score: 21
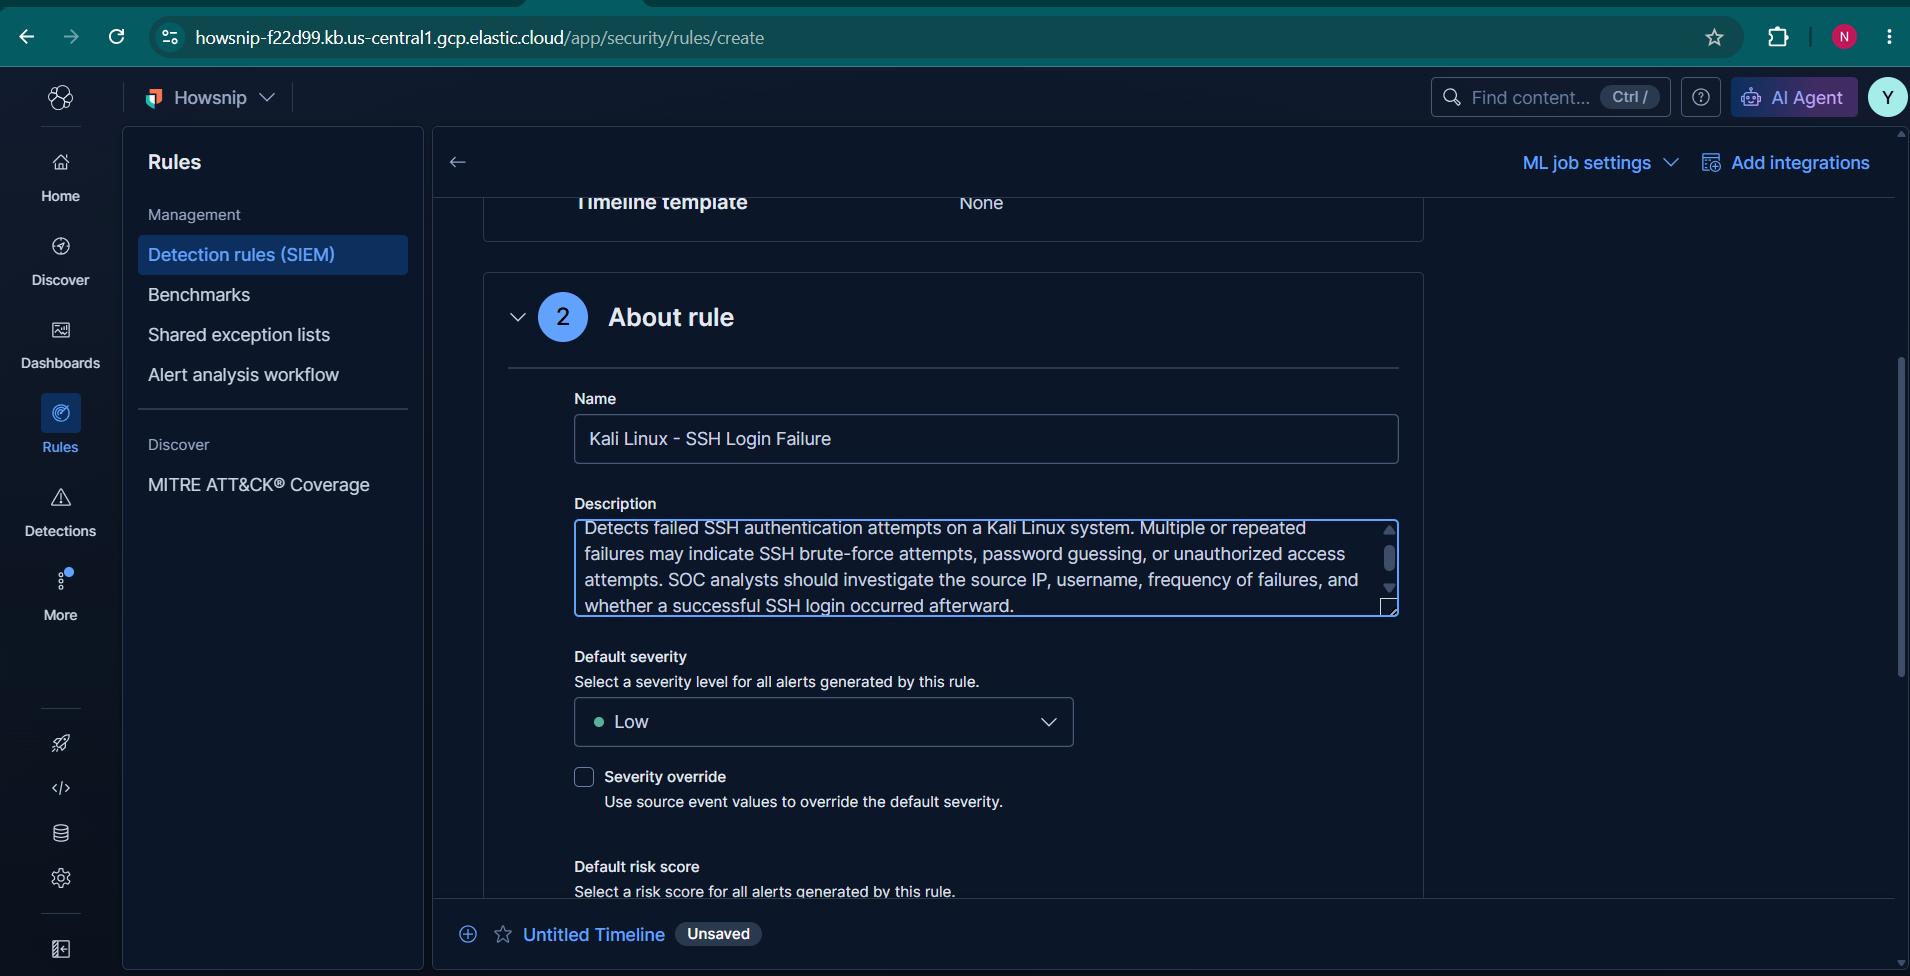
Adding a descriptive name and explanation helps analysts quickly understand the purpose of the rule when reviewing alerts.
Scheduling the Rule
Configure the rule to:
- Run every 5 minutes
- Use a 1-minute look-back window
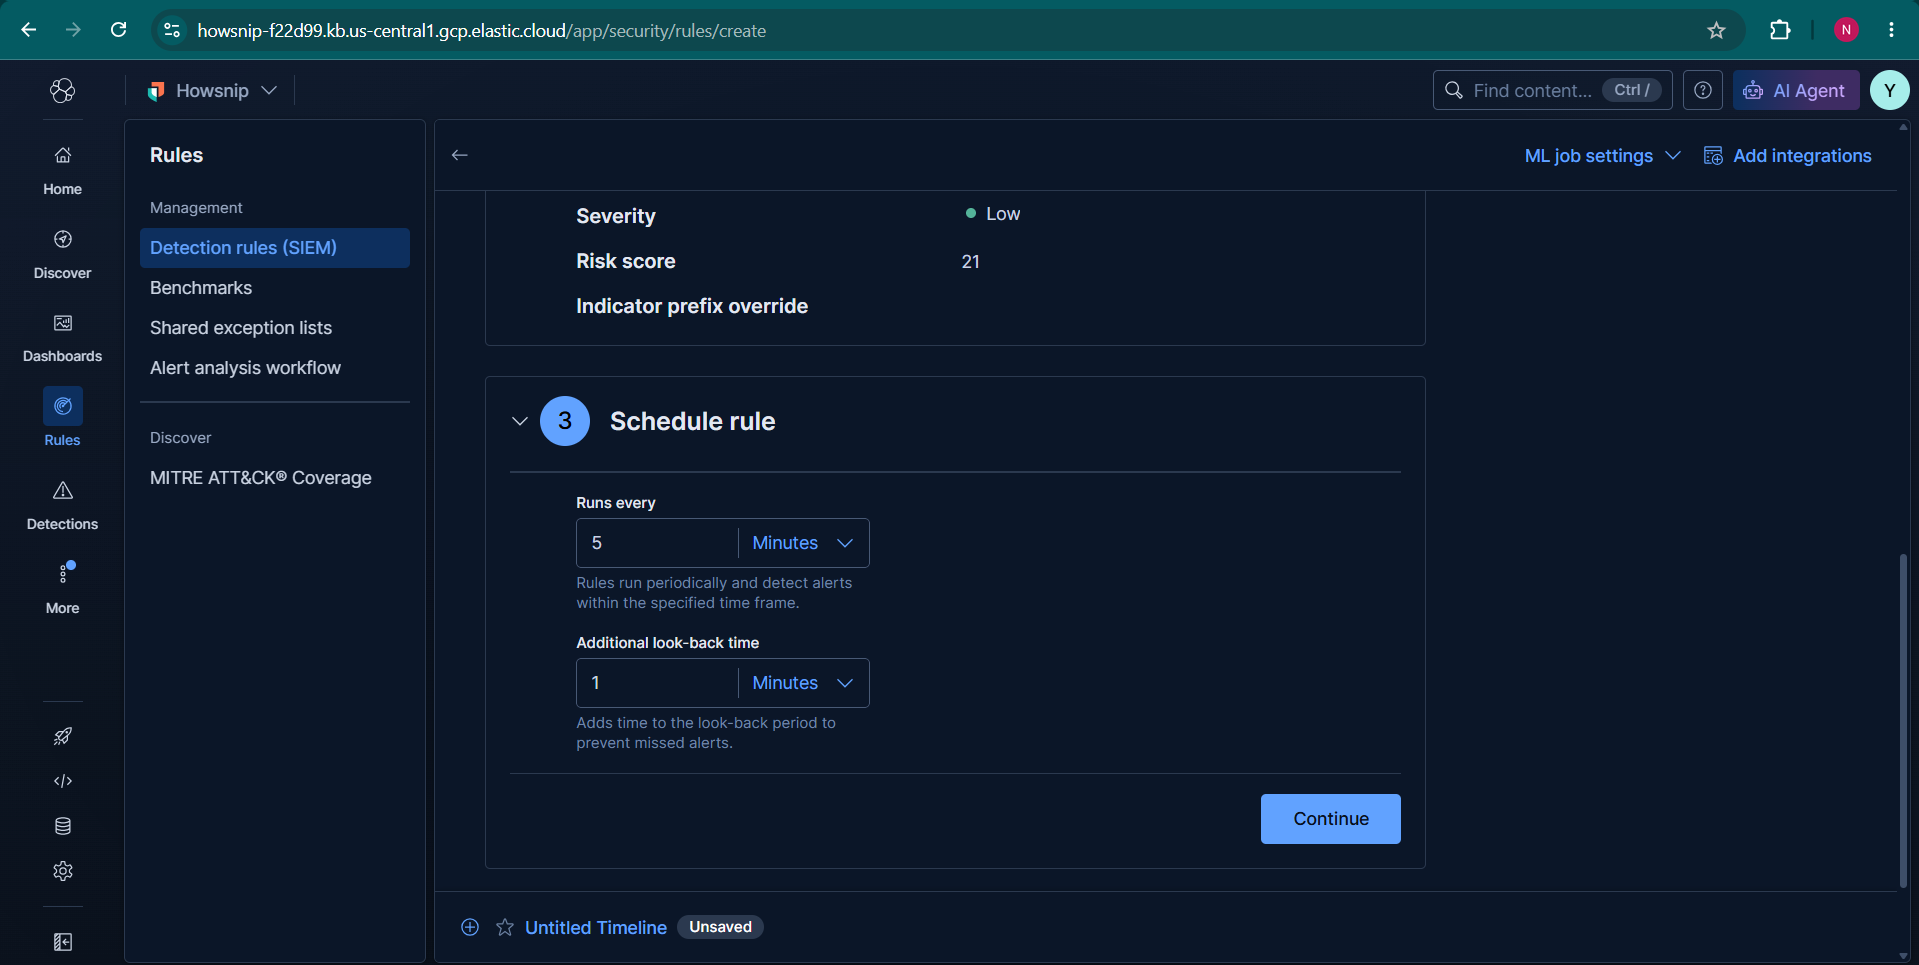
This schedule enables continuous monitoring while ensuring recently ingested events are included in each evaluation cycle.
Enabling the Rule
After saving the configuration, enable the detection rule. Once active, Elastic continuously evaluates incoming data against the defined query and generates alerts whenever matching events are detected.
Conclusion
Creating a Simple SIEM Home Lab Using Elastic Cloud is an effective way to understand how security data flows from endpoints to a centralized monitoring platform. With Elastic Defend collecting telemetry from Kali Linux, dashboards providing visibility into system activity, and custom detection rules identifying failed SSH login attempts, the environment delivers hands-on experience with core SIEM concepts.
As additional systems and data sources are added, the lab can be expanded into a more advanced security monitoring environment while continuing to build practical skills in detection, investigation, and threat monitoring.