

Prometheus is one of the most widely used open-source monitoring and alerting platforms for modern infrastructure. It collects metrics from servers, applications, containers, and services, stores them as time-series data, and enables you to query and visualize performance information in real time.
In this tutorial, you’ll learn how to install Prometheus on Ubuntu 26.04 LTS, configure it as a system service, monitor server metrics using Node Exporter, create alerting rules, and integrate Alertmanager for alert notifications.
Note: The software versions used in this guide were current at the time of writing. Always verify the latest releases on the official Prometheus GitHub repositories before downloading.
What You’ll Learn
By the end of this guide, you will be able to:
- Install Prometheus on Ubuntu 26.04
- Configure Prometheus as a systemd service
- Monitor server resources with Node Exporter
- Create custom alert rules
- Configure Alertmanager for notifications
- Verify monitored targets and alert status through the Prometheus web interface
Prerequisites
Before getting started, ensure you have:
- A fresh Ubuntu 26.04 LTS server
- SSH access to the server
- A user account with sudo privileges
- Internet connectivity for downloading packages and binaries
Step 1: Update the System
Start by updating your package index to ensure your system has the latest package information.
sudo apt update
This refreshes the local package database and helps prevent package installation issues caused by outdated repository information.
Step 2: Create a Dedicated Prometheus User and Group
Running Prometheus under its own system account improves security by limiting permissions.
Create the Prometheus group:
sudo groupadd --system prometheusNext, create the Prometheus user and assign it to the newly created group:
sudo useradd --no-create-home --shell /sbin/nologin --system -g prometheus prometheus
What these options do
- –system creates a system account.
- –no-create-home prevents creation of a home directory.
- –shell /sbin/nologin disables interactive login access.
Step 3: Create Directories for Prometheus
Prometheus requires separate locations for configuration files and metric data storage.
Create the configuration directory:
sudo mkdir /etc/prometheusCreate the data storage directory:
sudo mkdir /var/lib/prometheusAssign ownership to the Prometheus user:
sudo chown prometheus:prometheus /etc/prometheus
sudo chown prometheus:prometheus /var/lib/prometheus
These permissions allow Prometheus to read its configuration and write metric data.
Step 4: Download and Install Prometheus
At the time of writing, Prometheus version 3.13.1 is used in this guide.
Download the release package:
curl -LO https://github.com/prometheus/prometheus/releases/download/v3.13.1/prometheus-3.13.1.linux-amd64.tar.gz
Extract the archive:
tar xvf prometheus-3.13.1.linux-amd64.tar.gz
Move into the extracted directory:
cd prometheus-3.13.1.linux-amd64Copy the Prometheus binaries:
sudo cp prometheus /usr/local/bin/
sudo cp promtool /usr/local/bin/
Set the correct ownership:
sudo chown prometheus:prometheus /usr/local/bin/prometheus
sudo chown prometheus:prometheus /usr/local/bin/promtool
About Promtool
promtool is a utility included with Prometheus that helps validate configuration files and alerting rules before deployment.
Important: Starting with Prometheus 3.x, the legacy consoles and console_libraries directories are no longer included. Most organizations now use Grafana for dashboards and visualization.
Step 5: Create the Prometheus Configuration File
Create the primary configuration file:
sudo tee /etc/prometheus/prometheus.yml > /dev/null <<'EOF'
global:
scrape_interval: 15s
evaluation_interval: 15s

scrape_configs:
- job_name: "prometheus"
static_configs:
- targets: ["localhost:9090"]
EOF
This configuration instructs Prometheus to:
- Scrape metrics every 15 seconds
- Evaluate alerting rules every 15 seconds
- Collect metrics from its own endpoint running on port 9090
Set the proper ownership:
sudo chown prometheus:prometheus /etc/prometheus/prometheus.yml
Step 6: Configure Prometheus as a Systemd Service
Creating a systemd unit file allows Prometheus to start automatically after system reboots.
Create the service file:
sudo tee /etc/systemd/system/prometheus.service > /dev/null <<'EOF'
[Unit]
Description=Prometheus Monitoring System
Wants=network-online.target
After=network-online.target

[Service]
User=prometheus
Group=prometheus
Type=simple
ExecStart=/usr/local/bin/prometheus \
--config.file=/etc/prometheus/prometheus.yml \
--storage.tsdb.path=/var/lib/prometheus/ \
--web.listen-address=0.0.0.0:9090

Restart=on-failure
RestartSec=5

[Install]
WantedBy=multi-user.target
EOF
Reload systemd and start Prometheus:
sudo systemctl daemon-reload
sudo systemctl enable --now prometheus
Check service status:
sudo systemctl status prometheus
Validate the configuration file:
promtool check config /etc/prometheus/prometheus.ymlAccess the Web Interface
Open your browser and visit:
http://your_server_ip:9090
To view monitored targets:
http://your_server_ip:9090/targets
Step 7: Install Node Exporter (Recommended)
By default, Prometheus only monitors itself. To collect server statistics such as CPU, RAM, storage, and network usage, install Node Exporter.
Download Node Exporter:
cd ~
curl -LO https://github.com/prometheus/node_exporter/releases/download/v1.12.1/node_exporter-1.12.1.linux-amd64.tar.gz
Extract the archive:
tar xvf node_exporter-1.12.1.linux-amd64.tar.gz
Copy the binary:
sudo cp node_exporter-1.12.1.linux-amd64/node_exporter /usr/local/bin/Create a Systemd Service for Node Exporter
Create the service file:
sudo tee /etc/systemd/system/node_exporter.service > /dev/null <<'EOF'
[Unit]
Description=Node Exporter
After=network.target

[Service]
User=prometheus
Group=prometheus
Type=simple
ExecStart=/usr/local/bin/node_exporter

[Install]
WantedBy=multi-user.target
EOF
Enable and start the service:
sudo systemctl daemon-reload
sudo systemctl enable --now node_exporter
Verify that it is running:
sudo systemctl status node_exporter
Add Node Exporter as a Scrape Target
Edit the Prometheus configuration and add the following job under scrape_configs:
- job_name: "my-node-1"
static_configs:
- targets: ["localhost:9100"]
Restart Prometheus:
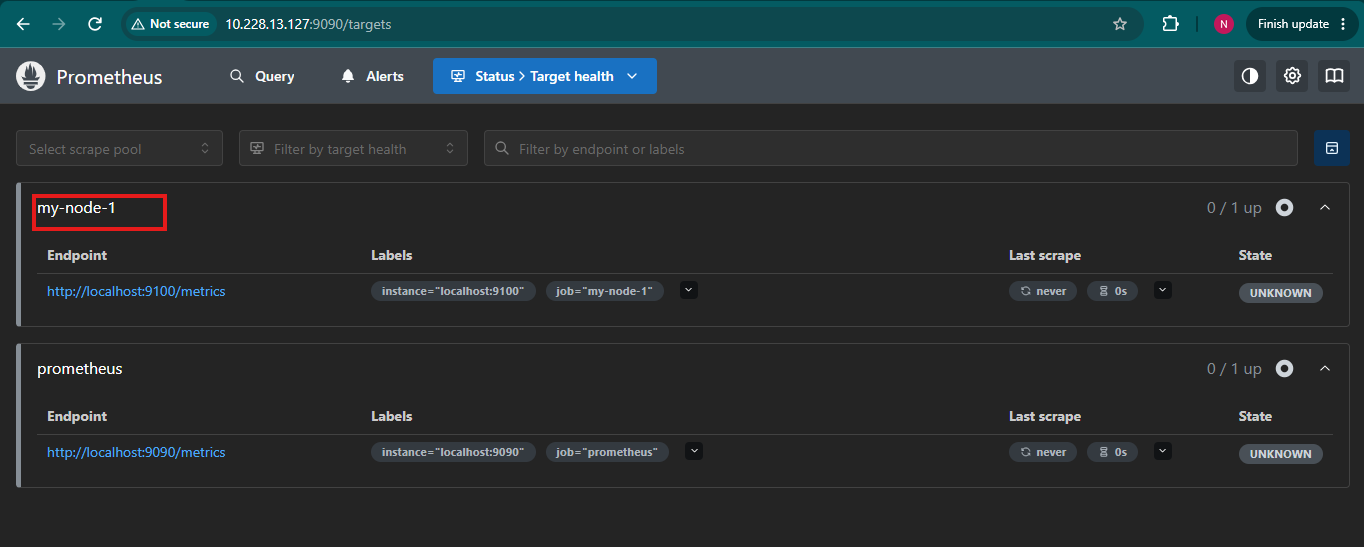
sudo systemctl restart prometheusAfter refreshing the Targets page, you should see the Node Exporter endpoint listed and marked as healthy.
Step 8: Configure Alert Rules
Alerting allows Prometheus to automatically detect issues such as high CPU usage, low disk space, or unavailable hosts.
Create a directory for alert rules:
sudo mkdir -p /etc/prometheus/rulesAssign ownership:
sudo chown prometheus:prometheus /etc/prometheus/rulesCreate the alert rules file:
sudo tee /etc/prometheus/rules/node_alerts.yml > /dev/null <<'EOF'
groups:
- name: node_alerts
rules:
- alert: HighCPUUsage
expr: 100 - (avg by(instance) (rate(node_cpu_seconds_total{mode="idle"}[5m])) * 100) > 90
for: 5m
labels:
severity: warning
annotations:
summary: "High CPU usage on {{ $labels.instance }}"
description: "CPU usage is above 90% for more than 5 minutes (current value: {{ $value | printf \"%.2f\" }}%)."

- alert: HighMemoryUsage
expr: (1 - (node_memory_MemAvailable_bytes / node_memory_MemTotal_bytes)) * 100 > 90
for: 5m
labels:
severity: warning
annotations:
summary: "High memory usage on {{ $labels.instance }}"
description: "Memory usage is above 90% for more than 5 minutes."

- alert: LowDiskSpace
expr: (node_filesystem_avail_bytes{fstype!~"tmpfs|overlay"} / node_filesystem_size_bytes{fstype!~"tmpfs|overlay"}) * 100 < 10
for: 10m
labels:
severity: critical
annotations:
summary: "Low disk space on {{ $labels.instance }}"
description: "Filesystem {{ $labels.mountpoint }} has less than 10% space remaining."

- alert: InstanceDown
expr: up == 0
for: 2m
labels:
severity: critical
annotations:
summary: "Instance {{ $labels.instance }} is down"
description: "{{ $labels.instance }} has been unreachable for more than 2 minutes."
EOF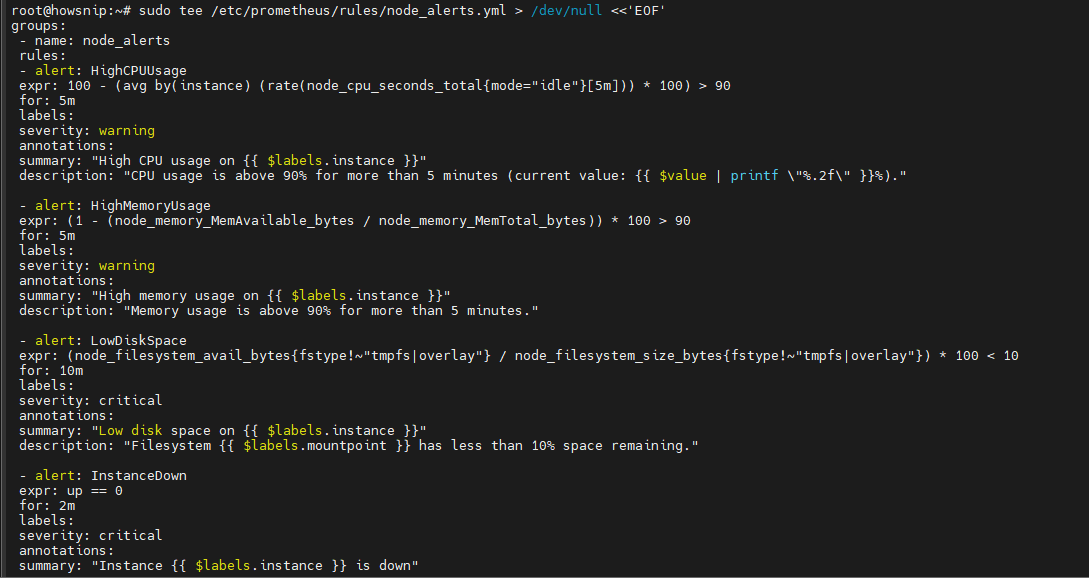
These rules create alerts for:
- High CPU utilization
- High memory consumption
- Low disk space
- Unreachable monitored systems
Assign ownership:
sudo chown prometheus:prometheus /etc/prometheus/rules/node_alerts.ymlLoad Alert Rules in Prometheus
Update /etc/prometheus/prometheus.yml and add:
rule_files:
- "rules/*.yml"
Your configuration should now resemble:
global:
scrape_interval: 15s
evaluation_interval: 15s

scrape_configs:
- job_name: "prometheus"
static_configs:
- targets: ["localhost:9090"]

- job_name: "my-node-1"
static_configs:
- targets: ["localhost:9100"]

rule_files:
- "rules/*.yml"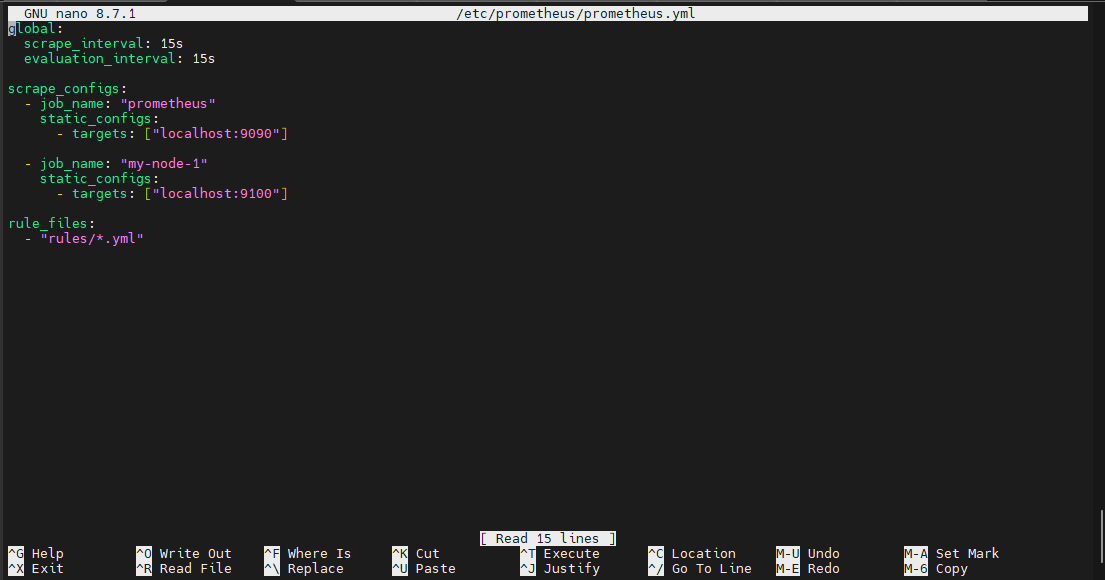
Validate the alert rules:
promtool check rules /etc/prometheus/rules/node_alerts.yml
Restart Prometheus:
sudo systemctl restart prometheusStep 9: Install and Configure Alertmanager
Alertmanager handles alerts generated by Prometheus and delivers notifications through email or other supported integrations.
a) Create the Alertmanager User and Group
sudo groupadd --system alertmanager

sudo useradd --no-create-home \
--shell /sbin/nologin \
--system \
-g alertmanager \
alertmanager
b) Create Alertmanager Directories
sudo mkdir -p /etc/alertmanager /var/lib/alertmanagerSet ownership:
sudo chown -R alertmanager:alertmanager /etc/alertmanager
sudo chown -R alertmanager:alertmanager /var/lib/alertmanager
c) Download and Install Alertmanager
Download and extract the release:
curl -LO https://github.com/prometheus/alertmanager/releases/download/v0.28.1/alertmanager-0.28.1.linux-amd64.tar.gz
tar xvf alertmanager-0.28.1.linux-amd64.tar.gz
cd alertmanager-0.28.1.linux-amd64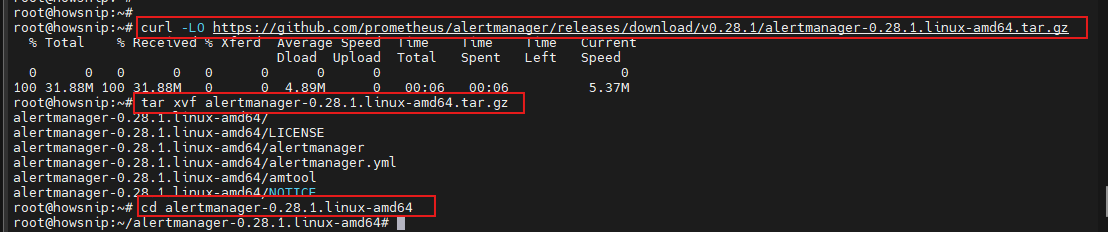
Install the binaries:
sudo cp alertmanager /usr/local/bin/
sudo cp amtool /usr/local/bin/

sudo chown alertmanager:alertmanager \
/usr/local/bin/alertmanager \
/usr/local/bin/amtool
d) Create the Alertmanager Configuration
Create the configuration file:
sudo tee /etc/alertmanager/alertmanager.yml > /dev/null <<'EOF'
route:
  receiver: "default"
  group_by: ["alertname", "instance"]
  group_wait: 30s
  group_interval: 5m
  repeat_interval: 4h

receivers:
- name: "default"
  email_configs:
    - to: "you@example.com"
    from: "alertmanager@example.com"
    smarthost: "smtp.example.com:587"
    auth_username: "alertmanager@example.com"
    auth_password: "your-smtp-password"
    send_resolved: true
EOF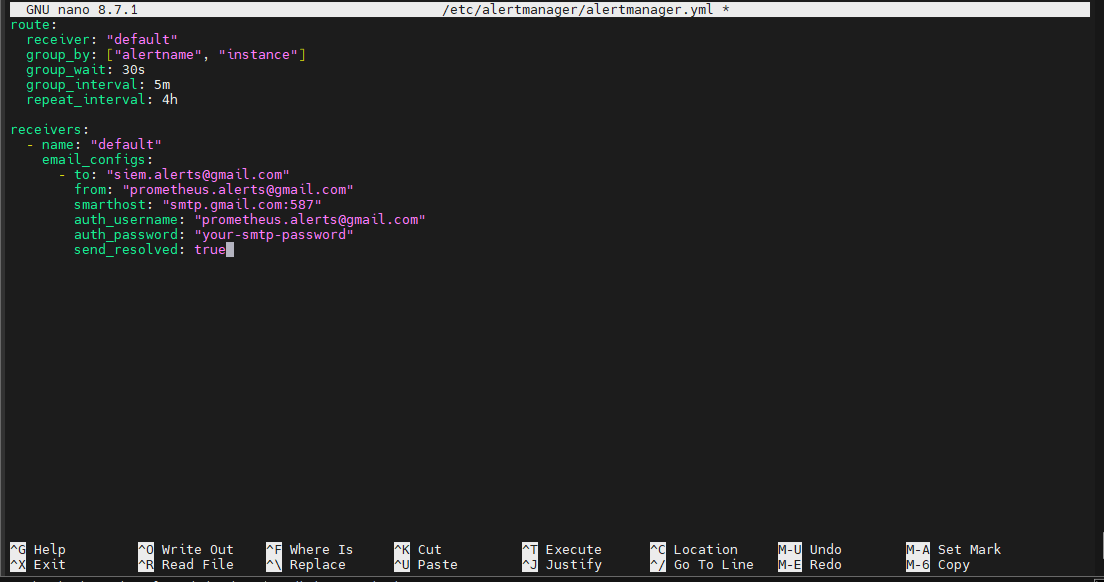
Replace the example email and SMTP settings with your actual mail server details.
Important: Alert notifications will not work until valid SMTP settings are configured.
e) Create the Alertmanager Service
Create the systemd service file:
sudo tee /etc/systemd/system/alertmanager.service > /dev/null <<'EOF'

[Unit]
Description=Alertmanager
Wants=network-online.target
After=network-online.target

[Service]
User=alertmanager
Group=alertmanager
Type=simple
ExecStart=/usr/local/bin/alertmanager \
  --config.file=/etc/alertmanager/alertmanager.yml \
  --storage.path=/var/lib/alertmanager/

Restart=on-failure
RestartSec=5

[Install]
WantedBy=multi-user.target
EOF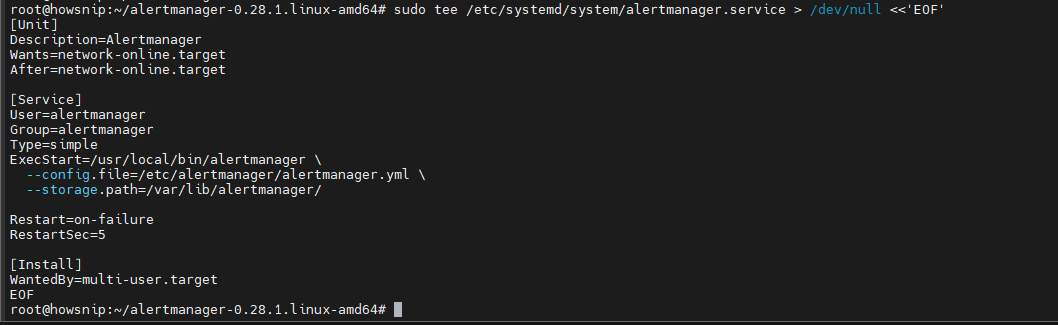
Enable and start the service:
sudo systemctl daemon-reload
sudo systemctl enable --now alertmanager
f) Connect Prometheus to Alertmanager
Add the following section to /etc/prometheus/prometheus.yml:
alerting:
  alertmanagers:
    - static_configs:
    - targets: ["localhost:9093"]
Restart Prometheus:
sudo systemctl restart prometheusg) Test Alerting
One simple way to test alerting is to stop Node Exporter temporarily:
sudo systemctl stop node_exporterAfter the configured threshold period, the InstanceDown alert should become active.
You can view active alerts from:
http://your_server_ip:9090/alerts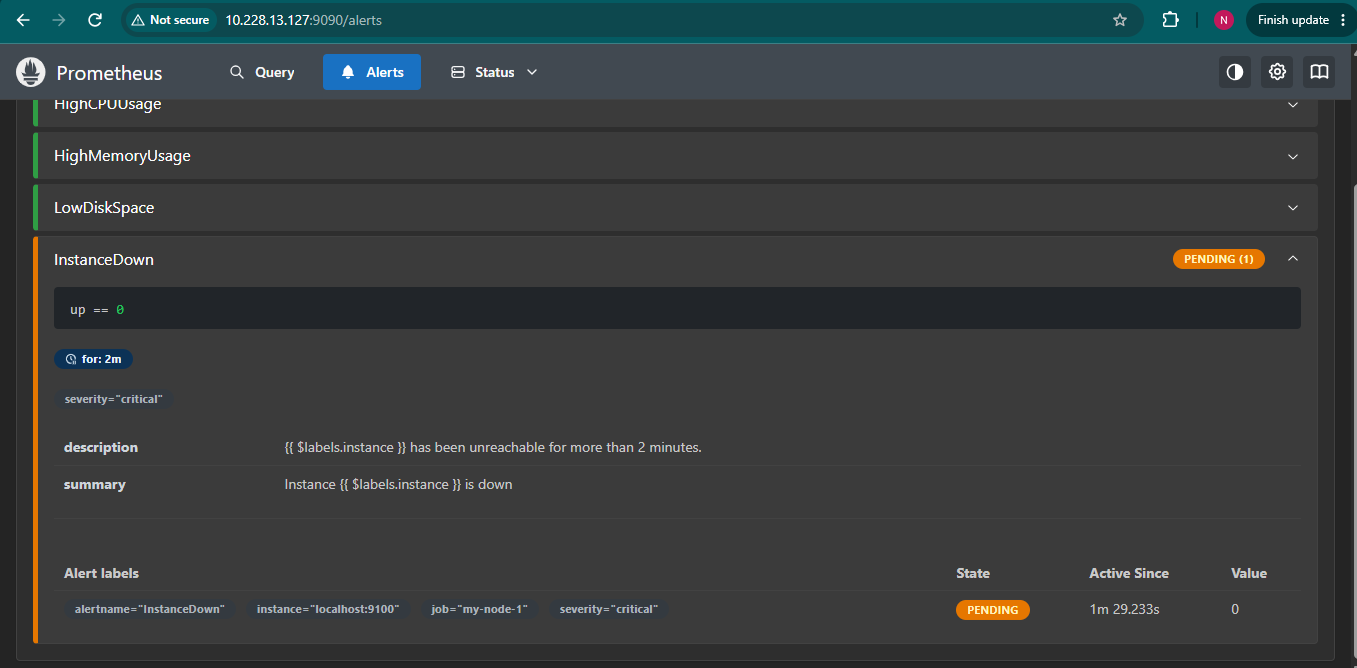
Conclusion
You have successfully installed Prometheus on Ubuntu 26.04 LTS and configured it to run as a system service. You also learned how to collect host metrics using Node Exporter, create alerting rules, and integrate Alertmanager for notifications.
With this foundation in place, you can begin monitoring servers, applications, and infrastructure components while receiving proactive alerts when issues arise.