Monitoring your servers, applications, and infrastructure is essential for maintaining performance and quickly identifying problems. Grafana is one of the most popular monitoring and visualization platforms available today, allowing you to transform complex metrics into easy-to-read dashboards.
In this tutorial, you’ll learn how to install Grafana on Ubuntu using the official Grafana repository. We’ll cover everything from updating your system and adding the Grafana repository to starting the service and accessing the Grafana web interface.
What Is Grafana?
Grafana is an open-source data visualization and monitoring platform that helps teams analyze metrics, logs, and performance data through interactive dashboards.
Grafana supports multiple data sources, including:
- Prometheus
- InfluxDB
- Elasticsearch
- MySQL
- PostgreSQL
- AWS CloudWatch
- Google Stackdriver
Because it can connect to various databases and monitoring systems, Grafana provides a centralized location for monitoring infrastructure, applications, and services.
Common Uses of Grafana
Grafana is widely used for:
- Infrastructure Monitoring – Track CPU usage, memory consumption, disk activity, and network performance.
- Application Monitoring – Analyze response times, errors, and user activity.
- DevOps & CI/CD Monitoring – Visualize deployment pipelines, build status, and testing metrics.
- Security Monitoring – Monitor authentication events, firewall activity, and system logs.
Prerequisites
Before installing Grafana, make sure you have:
- An Ubuntu server or VPS.
- SSH access to the server.
- A user account with sudo privileges.
- Internet access to download packages from the official Grafana repository.
Follow the steps below to install Grafana on your Ubuntu server.
Step 1: Update System Packages
Start by updating your package index and upgrading installed packages.
sudo apt-get update && sudo apt-get upgrade -y
What this command does
- apt-get update refreshes the package list from configured repositories.
- apt-get upgrade -y installs available package updates automatically.
Keeping the system updated helps prevent compatibility issues during installation.
Step 2: Install Required Dependencies
Grafana installation requires a few supporting packages. Install them using:
sudo apt-get install -y apt-transport-https software-properties-common wget
These packages are required for securely adding and accessing the Grafana repository.
Step 3: Import the Grafana GPG Key
Before installing packages from the Grafana repository, import the official GPG key so Ubuntu can verify package authenticity.
Run the following commands:
sudo mkdir -p /etc/apt/keyrings/
wget -q -O - https://apt.grafana.com/gpg.key | gpg --dearmor | sudo tee /etc/apt/keyrings/grafana.gpg > /dev/null
What this step does
- Creates a directory for storing repository signing keys.
- Downloads Grafana’s official GPG key.
- Converts the key into a format recognized by APT.
- Stores the key securely for package verification.
This security measure helps ensure that packages are downloaded from a trusted source.
Step 4: Add the Official Grafana Repository
Next, add the Grafana APT repository to your server.
echo "deb [signed-by=/etc/apt/keyrings/grafana.gpg] https://apt.grafana.com stable main" | sudo tee -a /etc/apt/sources.list.d/grafana.list
By adding the official repository, Ubuntu can:
- Download Grafana packages directly from Grafana.
- Receive future updates through the APT package manager.
- Install the latest stable release available in the repository.
Step 5: Refresh the Package Index
After adding a new repository, update the package index again so Ubuntu can retrieve the available Grafana packages.
sudo apt-get update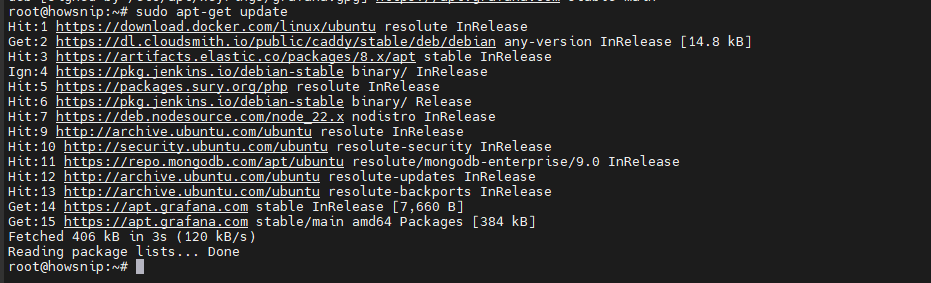
APT refreshes its package database and includes package information from the newly added Grafana repository.
Step 6: Install Grafana
You can install either the open-source edition or the Enterprise edition.
Option 1: Install Grafana OSS
To install the free open-source version:
sudo apt-get install grafana -y
Option 2: Install Grafana Enterprise
To install Grafana Enterprise:
sudo apt-get install grafana-enterprise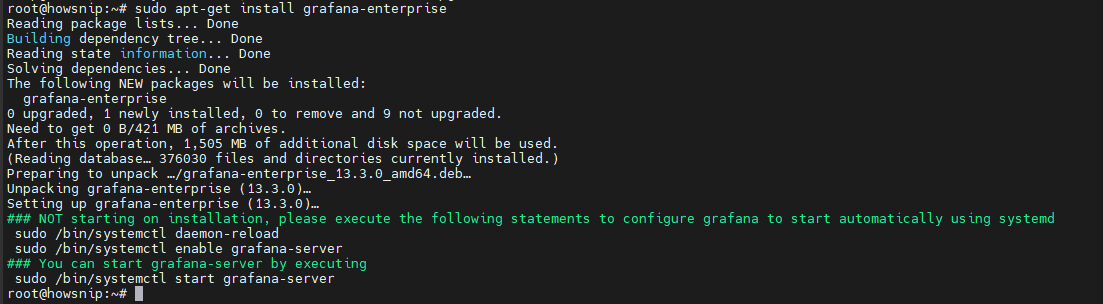
Step 7: Start and Enable the Grafana Service
After the installation is complete, start the Grafana service.
Start Grafana
sudo systemctl start grafana-serverThis launches the Grafana server immediately.
Enable Grafana at Boot
sudo systemctl enable grafana-server.service
This ensures Grafana automatically starts whenever the server reboots.
Verify Service Status
sudo systemctl status grafana-server
If everything is working correctly, the service status should indicate that Grafana is active and running.
Step 8: Configure Firewall Access
Grafana uses port 3000 by default. If your server is protected by UFW, allow traffic on this port.
Check Firewall Status
sudo ufw status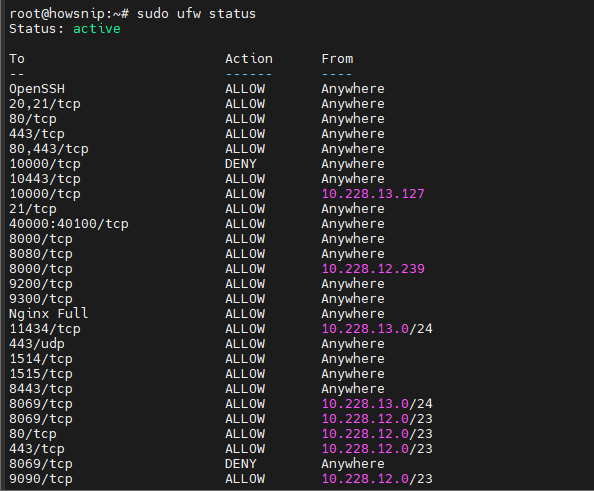
This command verifies whether UFW is active on the server.
Allow Grafana Traffic
sudo ufw allow 3000/tcpThis permits incoming TCP connections on port 3000.
Reload Firewall Rules
sudo ufw reloadReloading UFW applies the new firewall configuration.
Important: If UFW is not enabled on your server, this step may not be necessary.
Step 9: Access the Grafana Web Interface
Once Grafana is running, open a web browser and navigate to your server’s address.
Remote Server Access
http://your_server_ip:3000
Replace your_server_ip with the actual IP address of your Ubuntu server.
Local Access
If you are accessing Grafana from the same machine where it is installed:
http://localhost:3000The Grafana login page should now appear.
Default Login Credentials
Use the following credentials for the initial login:
- Username – admin
- Password – admin
After signing in, Grafana will prompt you to change the default password.

Warning: For security reasons, change the default administrator password immediately after your first login.

Conclusion
Grafana provides a powerful way to monitor servers, applications, and infrastructure through customizable dashboards and real-time visualizations. By following this guide, you have successfully installed Grafana on Ubuntu, configured the official repository, started the Grafana service, adjusted firewall settings, and accessed the Grafana web interface.
Your Grafana instance is now ready to connect to data sources such as Prometheus, InfluxDB, Elasticsearch, MySQL, and PostgreSQL, allowing you to build dashboards and monitor your environment from a single location.