

Sysstat is one of the most useful Linux performance-monitoring toolsets available. It helps administrators and developers troubleshoot CPU bottlenecks, disk I/O issues, memory pressure, network congestion, and process-level resource consumption.
In this tutorial, you’ll learn how to install Sysstat and use its three most powerful tools:
- mpstat for CPU monitoring
- pidstat for process-level resource analysis
- sar for real-time and historical performance monitoring
Prerequisites
Before you begin:
- A Linux system with sudo privileges
- Sysstat package installed
- Basic familiarity with the Linux terminal
Important: Some options such as %wait in pidstat and %ifutil in sar were introduced in newer Sysstat releases. Verify your installed version before using all examples.
Install Sysstat in Linux
Sysstat is not installed by default on many Linux distributions. Run the appropriate command for your distribution:
Debian, Ubuntu, and Linux Mint
sudo apt install sysstat
RHEL, CentOS, Fedora, Rocky Linux, and AlmaLinux
sudo dnf install sysstatAlpine Linux
sudo apk add sysstatArch Linux
sudo pacman -S sysstatopenSUSE
sudo zypper install sysstatFreeBSD
sudo pkg install sysstatVerify the Installation
Check that Sysstat is installed correctly:
mpstat -V
If you receive a “command not found” error, run the following command:
which mpstatThis helps confirm whether the binary exists and is accessible through your system’s PATH.
Ubuntu Note: Sysstat data collection is disabled by default on Ubuntu. Enable it by setting:
ENABLED="true"in:
/etc/default/sysstatUsing mpstat to Monitor CPU Usage
The mpstat utility displays CPU usage statistics for all processors or individual CPU cores. It is particularly useful on multi-core systems because it shows how workload is distributed across CPUs.
1. Display Overall CPU Statistics
Run:
mpstat
This command displays CPU usage averages since system boot.
- %iowait: High values (typically above 10–15%) may indicate storage bottlenecks.
- %soft: Elevated values can suggest heavy software interrupt activity, often related to network processing.
2. Show Statistics for All CPU Cores
To view usage for every processor:
mpstat -P ALL
This command helps identify whether workload is evenly distributed or concentrated on a single CPU core.
You can also monitor a specific core:
mpstat -P 03. Monitor CPU Activity Over Time
Collect five samples at two-second intervals:
mpstat -P ALL 2 5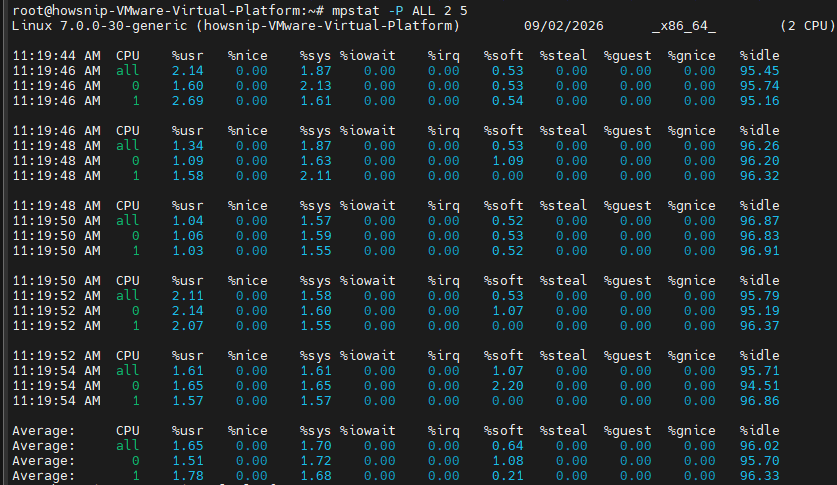
Explanation:
- 2 = sample interval in seconds
- 5 = number of samples
The final Average section summarizes all collected samples. To monitor continuously, omit the count value and stop with Ctrl+C.
4. View Interrupt Statistics Per CPU
To inspect interrupt activity:
mpstat -I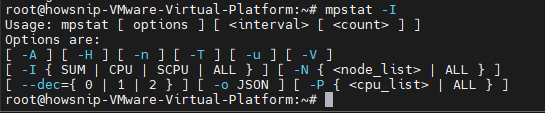
This is useful when troubleshooting:
- High network traffic
- Storage controller activity
- Uneven interrupt distribution across CPUs
If interrupts are concentrated on one core, IRQ balancing may need adjustment.
5. Display CPU and Interrupt Statistics Together
Use:
mpstat -A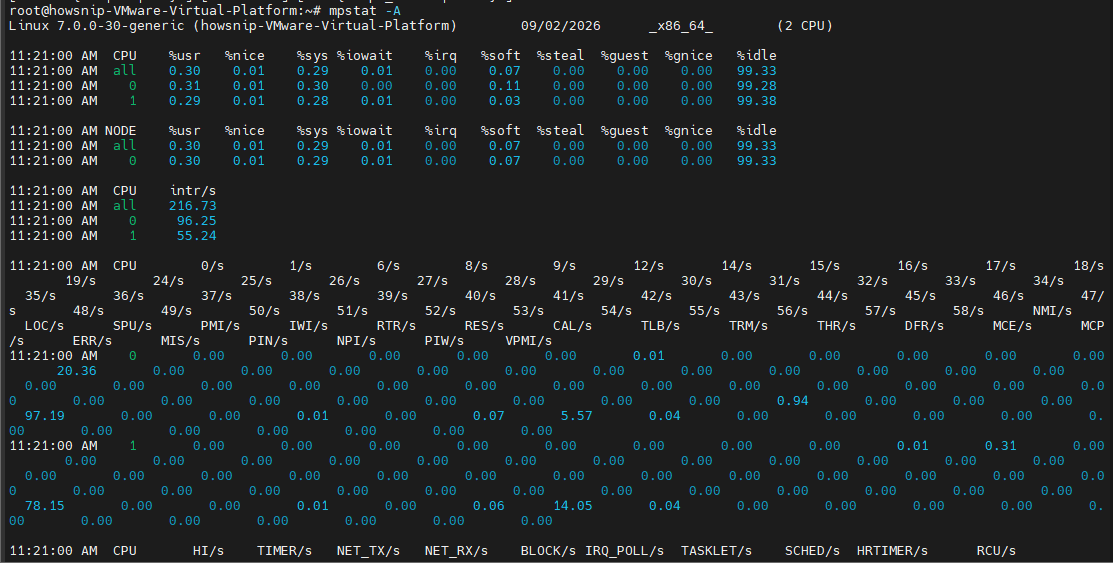
This option combines multiple reports into a comprehensive CPU and interrupt overview.
- Save Output to a Log File
- mpstat -A >> /var/log/mpstat-$(date +%F).log
This creates a simple timestamped record that can be reviewed later.
Using pidstat for Process-Level Monitoring
After identifying a busy CPU with mpstat, use pidstat to determine which process is responsible. Unlike top, pidstat provides detailed CPU, memory, I/O, and thread-level statistics that are easy to script and analyze.
6. List Active Processes and CPU Usage
Run:
pidstat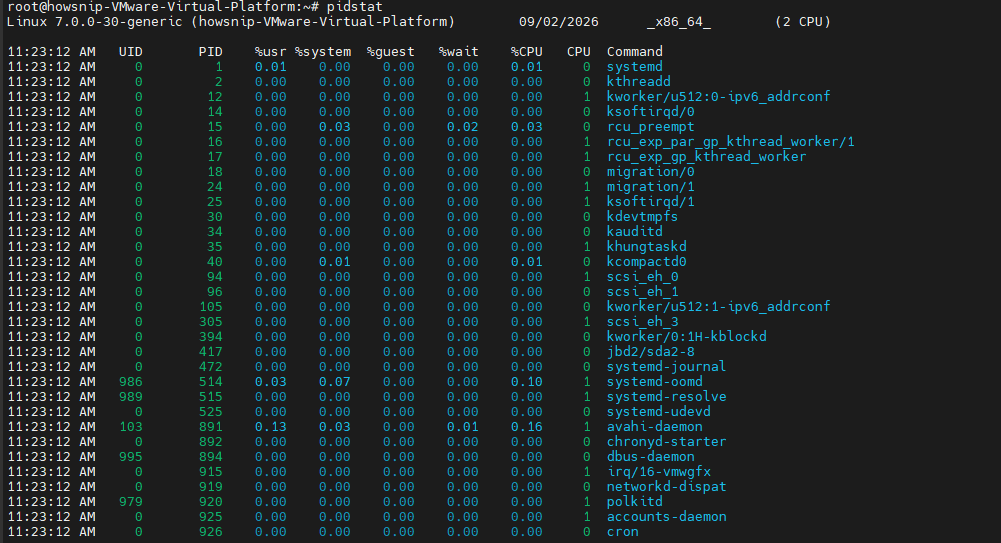
This displays CPU usage statistics for active processes.
- %wait: Time a runnable process waits for CPU scheduling.
- CPU: The processor on which the task most recently executed.
Sustained non-zero %wait values may indicate CPU contention.
7. Display All Processes
To include idle and sleeping processes:
pidstat -p ALL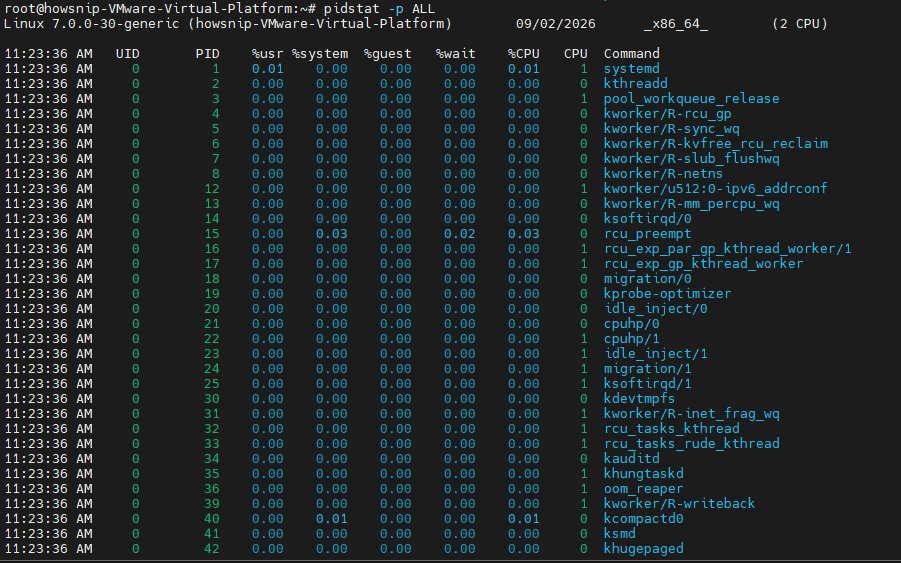
This can help:
- Verify services are running
- View kernel worker threads
- Obtain complete PID information
If an expected process does not appear, it is not currently running.
8. Monitor Disk I/O by Process
Switch to disk activity reporting:
pidstat -d 2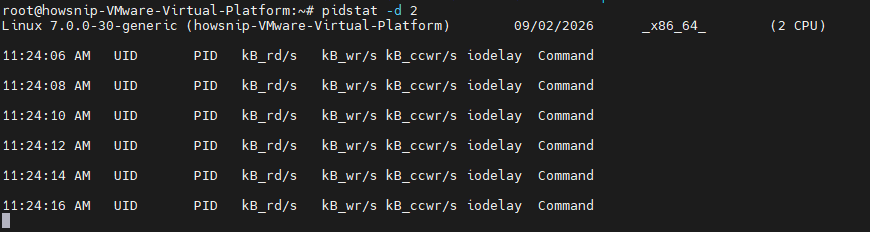
This displays I/O statistics every two seconds.
- kB_rd/s: Kilobytes read per second
- kB_wr/s: Kilobytes written per second
- kB_ccwr/s: Cancelled writes
- iodelay: Time spent waiting on I/O
If high iodelay aligns with elevated %iowait from mpstat, the process is likely causing storage delays.
9. View CPU Usage Per Thread
To analyze threads within a process:
pidstat -t -p 75154 2 3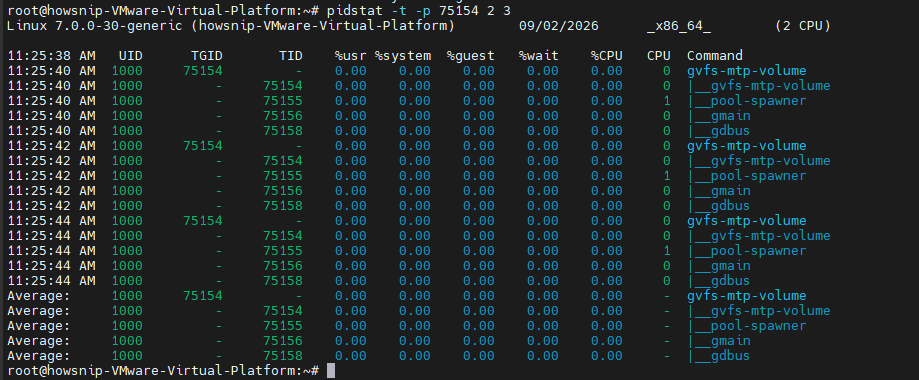
Replace 75154 with your target process ID.
If needed, locate the PID first:
pgrep <process-name>This helps identify situations where a single thread is consuming most of the CPU resources.
10. Monitor Memory Usage Per Process
Use:
pidstat -rh 2 3
The command reports:
- Virtual memory usage
- Resident memory usage
- Page fault statistics
- Watch the majflt/s Column
Major page faults occur when data must be retrieved from disk or swap space. Consistently non-zero values may indicate memory pressure or active swapping.
11. Filter Processes by Name
To monitor a specific application:
pidstat -G gvfs-mtp-volume
For continuous monitoring:
pidstat -G nginx 2To include thread information:
pidstat -t -G nginxIf no results are displayed, verify the actual process name:
ps aux | grep nginx12. View Scheduling Policy and Priority
Display scheduling information:
pidstat -R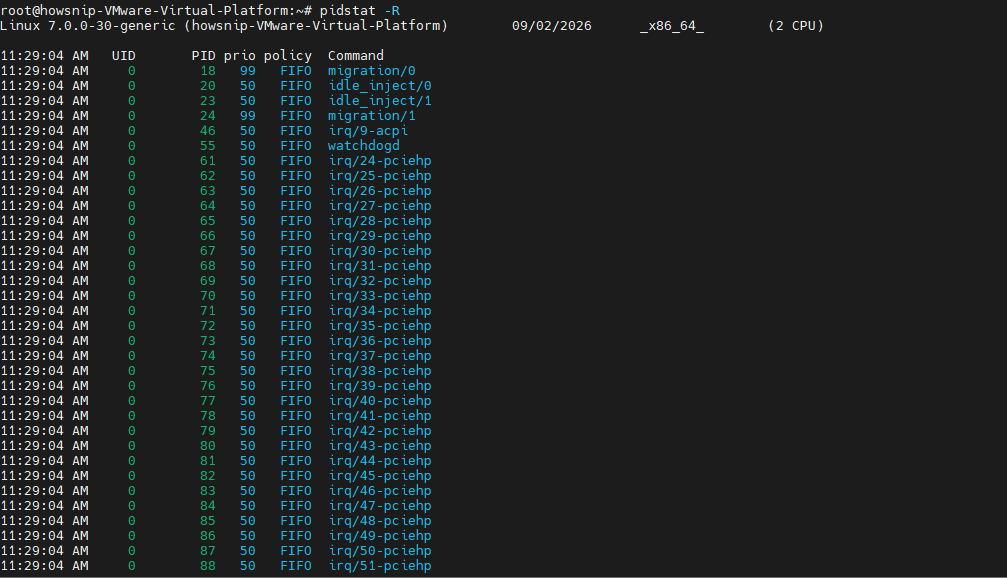
This shows:
- Scheduling policy
- Real-time priority levels
It is useful when a latency-sensitive application appears starved despite low overall CPU utilization.
Using sar for Historical Performance Analysis
While mpstat and pidstat provide live performance information, sar allows you to review both current and historical system activity. This makes it possible to investigate performance issues that occurred hours or even days earlier.
13. Record CPU Statistics to a Binary Log
Collect data and save it:
sar -u -o /tmp/sarfile 2 5
This records five CPU samples at two-second intervals.
Replay Saved Data
sar -u -f /tmp/sarfileExport Data
sadf -d /tmp/sarfileThe generated file is binary and must be read using sar or sadf.
14. Configure Automatic Data Collection
To continuously collect performance metrics, add the following entries to root’s crontab:
sudo crontab -e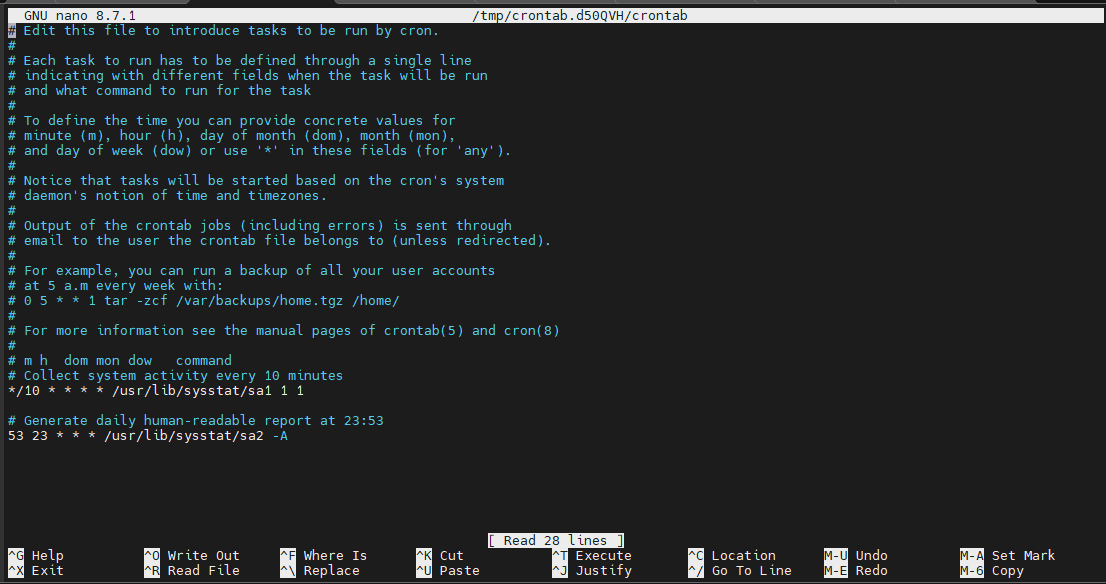
Add:
Collect system activity every 10 minutes
*/10 * * * * /usr/lib/sysstat/sa1 1 1Generate daily report
53 23 * * * /usr/lib/sysstat/sa2 -AVerify Collection
ls -lh /var/log/sysstat/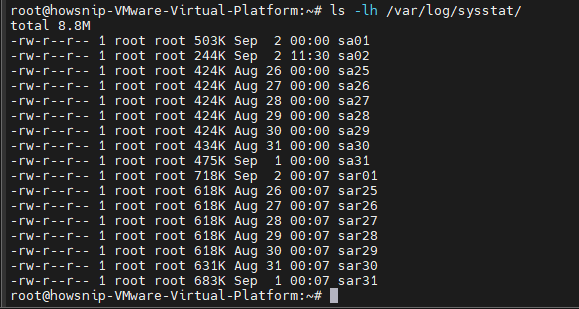
Check the sa1 Path
Before creating cron entries, verify the correct location:
which sa1On some RHEL-based systems the utility may reside in a different directory.
15. Monitor Run Queue and Load Average
To examine queue lengths and system load:
sar -q 2 5
Important fields include:
- runq-sz: Number of processes waiting for CPU time
- blocked: Processes waiting on I/O
- load averages: Overall system workload
On a four-core system, a sustained runq-sz above 4 often indicates CPU saturation.
16. Monitor Filesystem Usage
Check filesystem capacity and inode usage:
sar -F 2 4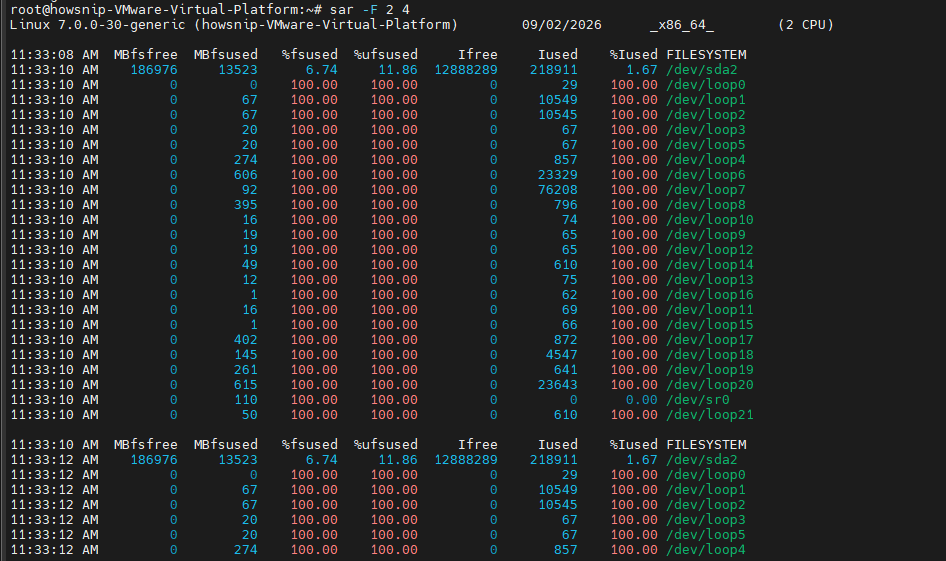
This helps identify storage growth trends and determine when a filesystem began filling up.
- %fsused
- %ufsused
These values help distinguish between total filesystem consumption and user-available space.
17. Monitor Network Traffic
Display network throughput statistics:
sar -n DEV 1 3 | grep -v lo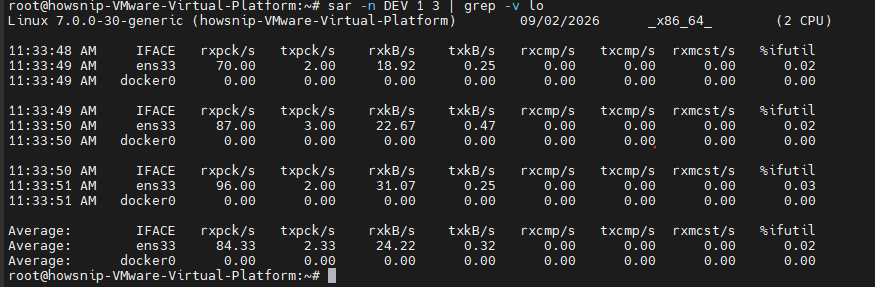
This excludes loopback traffic for a cleaner view.
Watch %ifutilIn newer Sysstat versions, %ifutil indicates interface utilization. Values consistently above 80% may suggest network saturation.
For additional troubleshooting:
sar -n EDEVThis reports network errors and dropped packets.
18. Monitor Block Device I/O Latency
Inspect disk performance with:
sar -d 1 3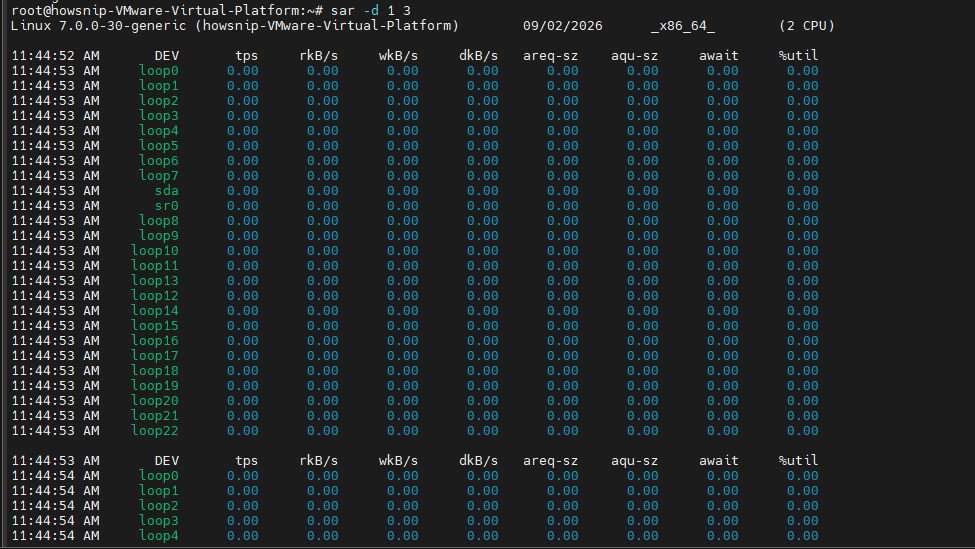
Key metrics include:
- await: Total request time
- svctm: Device service time
- aqu-sz: Average queue size
A large difference between await and svctm often indicates excessive queueing rather than a slow storage device.
19. Monitor Memory and Commit Statistics
Display memory metrics:
sar -r 1 3
When %commit exceeds 100%, processes have collectively requested more memory than the system can fully back with RAM and swap. Persistently high values may indicate heavy write activity.
20. Export Historical sar Data to CSV
Convert stored Sysstat data into CSV format:
sadf -d /var/log/sysstat/sa04 -- -n DEV | grep -v lo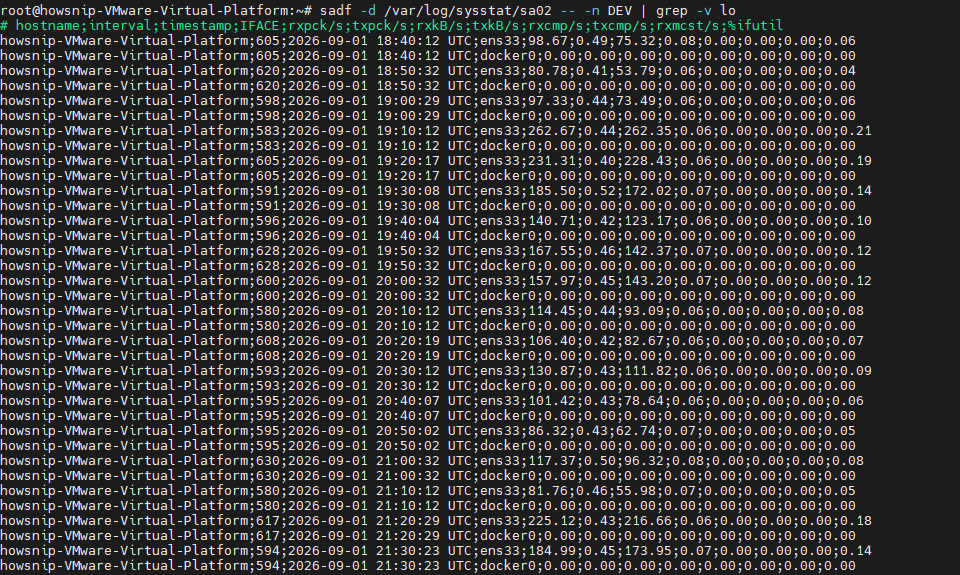
To save the output:
sadf -d /var/log/sysstat/sa02 -- -n DEV > /tmp/network-$(date +%F).csv
The resulting file can be imported into spreadsheet software, monitoring tools, or custom reporting scripts for further analysis.
Conclusion
Sysstat provides a powerful set of tools for Linux performance troubleshooting and capacity planning. Configuring automatic sar data collection is especially valuable because it gives you historical insights when investigating problems after they occur.