

When a production server starts responding slowly, returns unexpected 504 Gateway Timeout errors, or suddenly crashes, the application code is not always the culprit. In many cases, the real issue lies in exhausted server resources such as CPU, memory, disk space, or storage I/O.
For Linux administrators, DevOps engineers, and backend developers, knowing how to monitor server resources directly from the command line is a crucial skill. Ubuntu provides a powerful set of built-in tools that help you identify bottlenecks quickly without requiring a graphical interface.
In this guide, you’ll learn the most useful Ubuntu server monitoring commands and how to use them effectively in production environments.
Why Resource Monitoring Matters
Production issues often appear as application problems when they’re actually infrastructure issues. Common symptoms include:
- Slow API responses
- 504 Gateway Timeout errors
- Unexpected application crashes
- High response times
- Server freezes or automatic reboots
Regular resource monitoring helps answer important questions such as:
- Is the CPU load increasing over time?
- Which CPU core is under the highest load?
- Is CPU usage caused by user processes, system processes, or I/O wait?
- Is the system experiencing high CPU steal time?
- Is available memory decreasing continuously?
- Which process is consuming the most RAM?
- Is a process causing a memory leak?
- Is cache or buffer usage unusually high?
- Is swap usage increasing over time?
- Is the system actively swapping data in and out?
- Which process is generating the most disk I/O?
- Is disk latency unusually high?
- Is disk throughput reaching its limit?
- Are there excessive disk read/write operations?
- Is the filesystem approaching its inode limit?
- Which filesystem is consuming the most space?
- Is disk usage growing unexpectedly?
- Which directories or files are consuming the most disk space?
- Are log files growing excessively?
- Is the network interface experiencing high traffic?
- Are there network errors, dropped packets, or retransmissions?
- Is network bandwidth approaching its capacity?
- Which process is generating the most network traffic?
- Are there too many active processes?
- Are there unusually high numbers of zombie or orphan processes?
- Which processes have been running for an unusually long time?
- Are any services consuming resources unexpectedly?
- Are there processes with unusually high CPU or memory usage?
- Are system load averages consistently above normal?
- Are there resource spikes at specific times?
- Is resource utilization consistently increasing over time?
- Are there signs of a runaway process?
- Are scheduled jobs causing periodic resource spikes?
- Is the server responding slowly because of resource contention?
- Are critical services still running normally?
- Has resource utilization changed significantly compared with the baseline?
A quick health check can save hours of troubleshooting and help prevent downtime before users are affected.
- Get a Quick System Health Overview
- Monitor CPU and Memory in Real Time
- Using Top
- Using Htop
- Analyze Memory (RAM) Usage
- Monitor Disk Usage
- Check Overall Disk Usage
- Find Large Directories
- Check CPU Information and Core Count
- Monitor Network Usage
- View Network Interface Statistics
- Real-Time Network Monitoring with nload
- Monitor Disk I/O Performance
- Find Resource-Hungry Processes
- Top Memory Consumers
- Top CPU Consumers
- Get a Live Performance Summary
1. Get a Quick System Health Overview
The fastest way to check overall server health is with the uptime command.
uptimeWhat It Shows
- System running time
- Logged-in users
- Load average for the last 1, 5, and 15 minutes
- Load average indicates how much work the CPU is handling.
- For example, if your server has 4 CPU cores:
- Load average around 4 → Normal
- Load average greater than 4 → CPU is under pressure
- Load average significantly above 4 → Potential performance bottleneck
This should be the first command you run when investigating a slow server.

2. Monitor CPU and Memory in Real Time
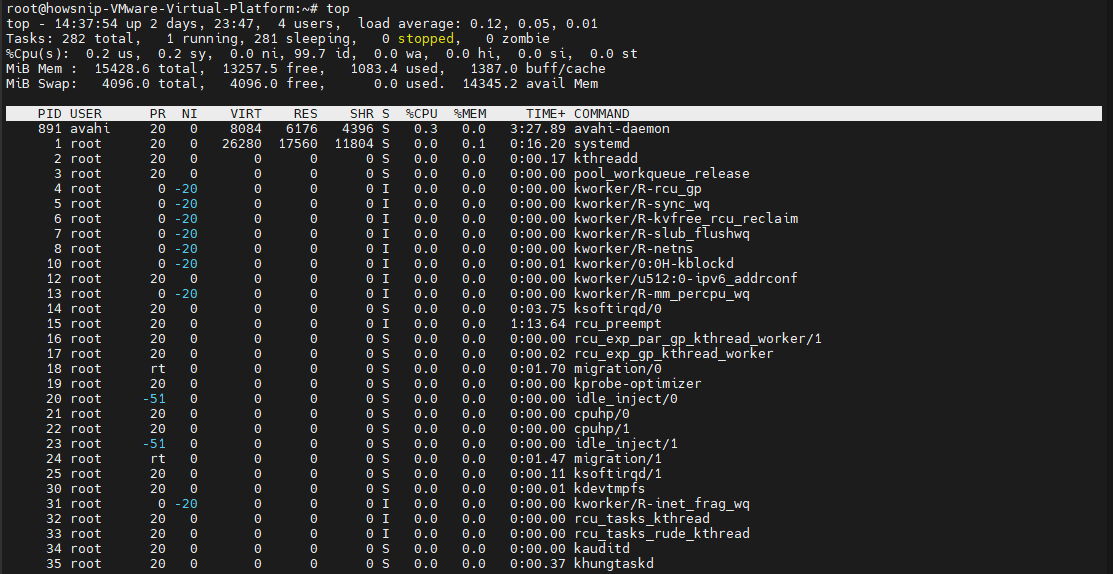
a) Using top
Ubuntu includes the top utility by default.
topImportant Metrics
- %CPU → CPU usage by process
- %MEM → Memory consumption by process
- load average → Overall system workload
Useful Keyboard Shortcuts
- Shift + P → Sort by CPU usage
- Shift + M → Sort by memory usage
- q → Exit
The top command provides a real-time snapshot of system performance and active processes.
b) Using htop (Highly Recommended)
Many administrators prefer htop because it offers a more user-friendly interface. To install htop, you can run the following command:
sudo apt install htop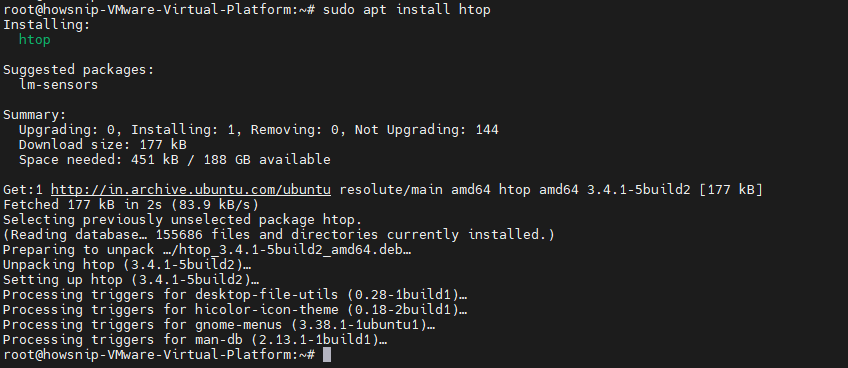
To launch htop, please run
htop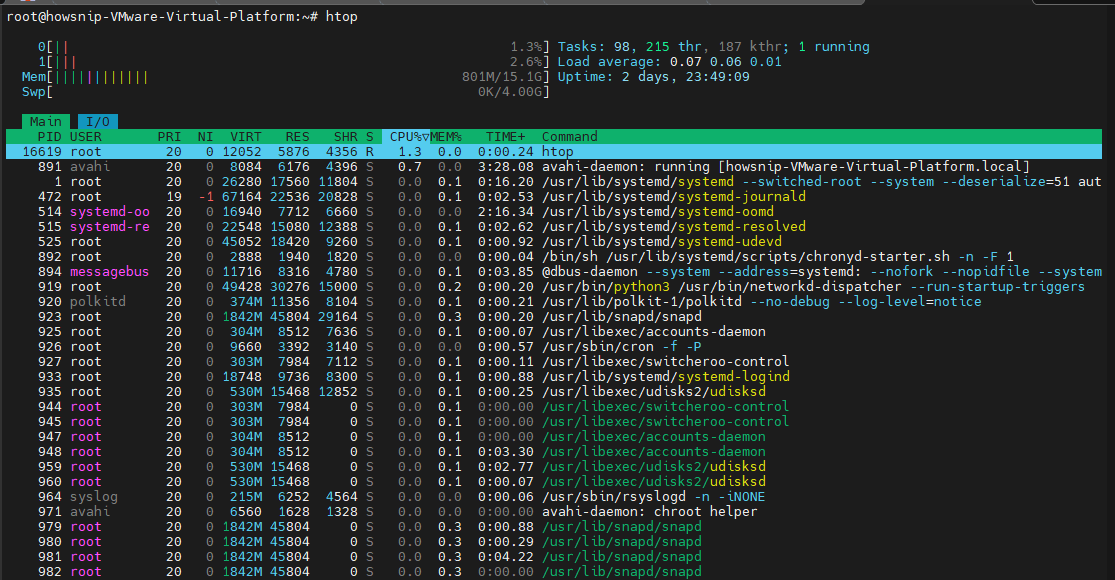
Why htop Is Better
- Color-coded CPU and memory usage
- Easy process management
- Process tree view
- Mouse support
- Better readability
For day-to-day production monitoring, htop is often the preferred choice over top.
3. Analyze Memory (RAM) Usage
Memory shortages can severely impact application performance.
Use the following command:
free -h
Many beginners focus on the free column, but that’s often misleading. Linux aggressively uses unused RAM for caching and buffering, which improves performance. The metric that actually matters is ‘available’.
If available memory becomes very low, the server may:
- Start using swap memory
- Slow down noticeably
- Kill processes due to memory pressure
4. Monitor Disk Usage
Running out of disk space can break services such as MySQL, Docker, Redis, and logging systems.
a) Check Overall Disk Usage
df -h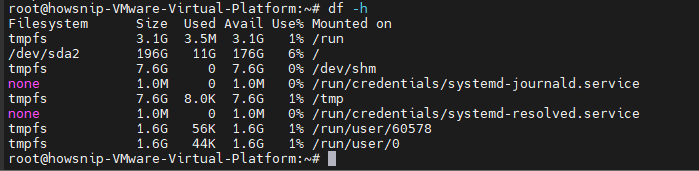
What You’ll See
- Total disk capacity
- Used storage
- Available storage
- Mounted filesystems
- Warning Sign
If any partition reaches 90% or higher usage, it should be investigated immediately.
b) Find Large Directories
To identify storage-heavy folders:
du -sh /var/log
Or check any directory:
du -sh /dev/shm
This command helps locate directories consuming excessive disk space.
5. Check CPU Information and Core Count
Understanding your CPU configuration helps interpret performance metrics more accurately.
Run:
lscpu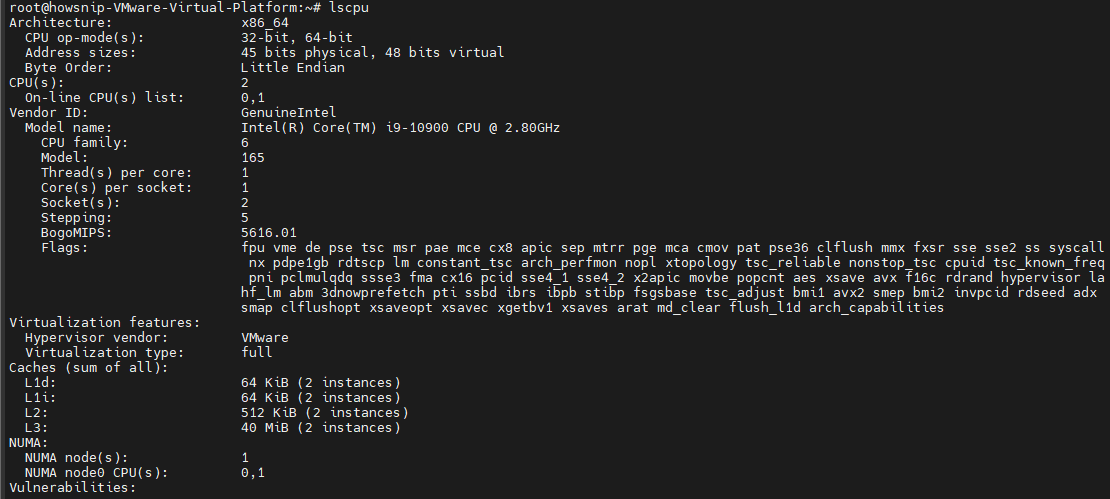
Information Provided
- CPU architecture
- Processor model
- Number of CPU cores
- Threads per core
- Virtualization details
Knowing the total number of CPU cores is especially important when evaluating system load averages.
6. Monitor Network Usage
Network congestion can cause slow APIs, delayed responses, and connection timeouts.
a) View Network Interface Statistics
ip -s link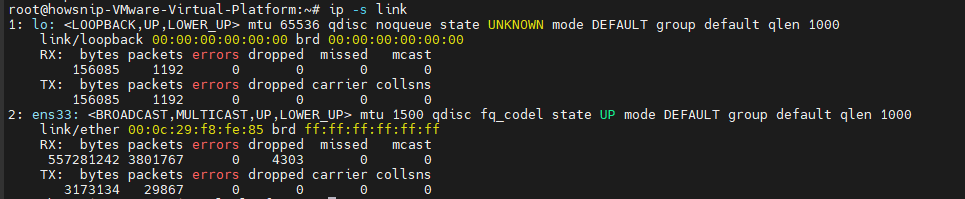
Displays
- Sent packets
- Received packets
- Errors and dropped packets
- Interface statistics
This is useful for a quick network health assessment.
b) Real-Time Network Monitoring with nload
Install nload:
sudo apt install nload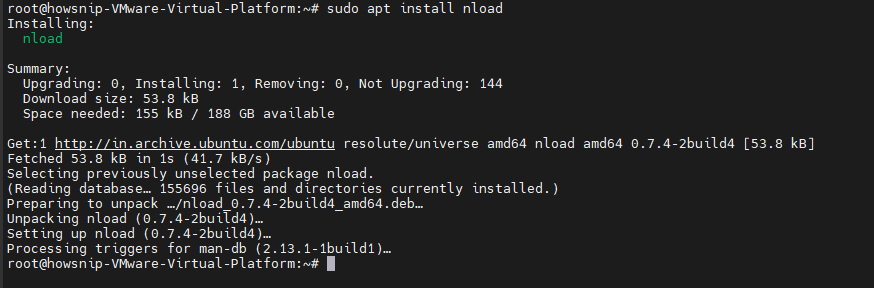
Launch it:
nload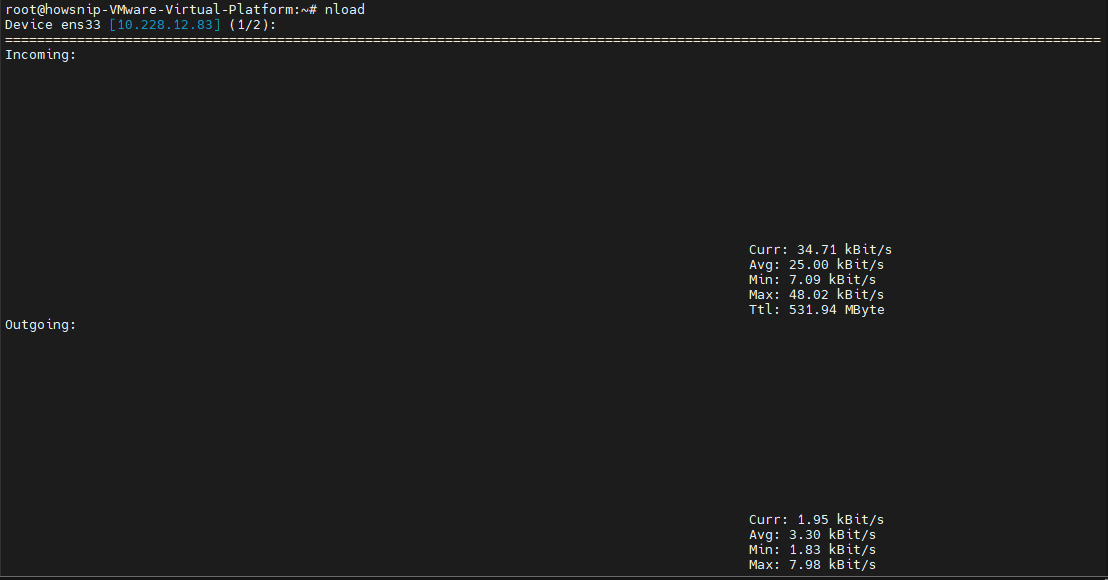
When nload Helps
- APIs feel unusually slow
- Upload or download speeds appear limited
- External service calls are timing out
- Large file transfers impact performance
The visual bandwidth graph makes it easy to spot network spikes.
7. Monitor Disk I/O Performance
Disk I/O is one of the most overlooked causes of slow applications. A server can have plenty of CPU and RAM available while still performing poorly due to storage bottlenecks.
Use:
iostat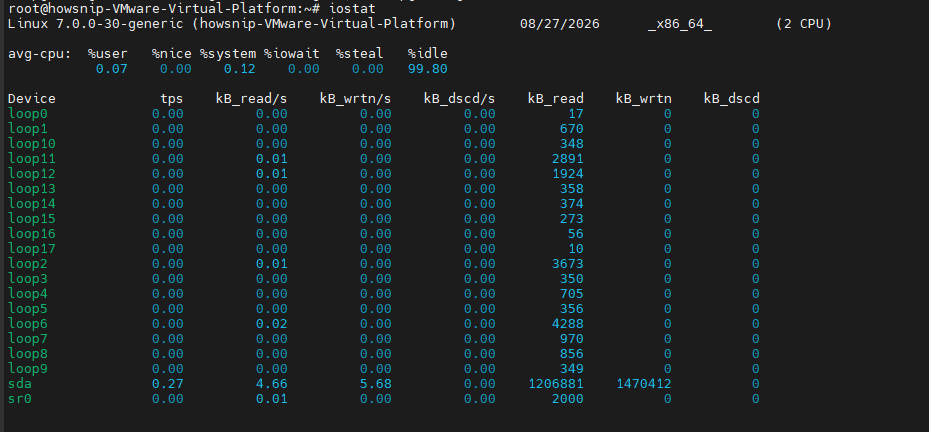
What to Look For
- High %iowait
- Slow read speeds
- Slow write speeds
- Overloaded storage devices
This command is especially valuable for:
- DB servers
- Logging-intensive applications
- Docker hosts
- File servers
If CPU usage looks normal but applications remain slow, disk I/O should be one of your first checks.
8. Find Resource-Hungry Processes
During incidents, identifying the process causing excessive CPU or memory consumption is critical.
a) Top Memory Consumers
ps aux --sort=-%mem | head
This displays the processes using the most RAM.
b) Top CPU Consumers
ps aux --sort=-%cpu | head
This displays the processes consuming the most CPU resources. These commands are extremely useful during production troubleshooting.
9. Get a Live Performance Summary
For a consolidated real-time view of system health, use:
vmstat 1
The 1 means the statistics refresh every second.
Metrics Included
- CPU activity
- Memory usage
- Swap utilization
- Disk I/O
- Process activity
Because it combines multiple metrics into a single output, vmstat is considered one of the most powerful troubleshooting tools available on Linux servers.
When investigating a slow or unhealthy server, follow this sequence:
- Step 1: Check Overall Health
- uptime
- Step 2: Monitor CPU and Memory
- htop
- Step 3: Verify Memory Availability
- free -h
- Step 4: Check Disk Usage
- df -h
- Step 5: Investigate Storage Performance
- iostat
- Step 6: Identify Problematic Processes
- ps aux –sort=-%cpu | head
- ps aux –sort=-%mem | head
This 6-step monitoring workflow helps you quickly identify whether the issue is related to CPU, memory, disk usage, storage performance, or a resource-hungry process. Start with a general health check and gradually move toward more detailed diagnostics.
Conclusion
Resource monitoring is one of the most important skills for anyone managing Ubuntu servers. The good news is that you don’t need expensive monitoring tools such as Sematext, Nagios or SolarWinds to perform basic troubleshooting. Ubuntu’s command-line tools provide fast, reliable, and accurate insights into system performance.
Pro Tip: Bookmark this guide and keep these commands handy. During production incidents, a few seconds spent checking system resources can save hours of debugging application code.