
Network troubleshooting is an essential skill for system administrators, network engineers, and cybersecurity professionals. One of the most powerful command-line tools available on Linux systems for packet analysis is tcpdump.
Tcpdump allows you to capture, filter, and analyze network traffic in real-time directly from the terminal. In this guide, we’ll explore some commonly used tcpdump commands and understand how they work.
What is Tcpdump?
Tcpdump is a packet analyzer that captures network packets flowing through a network interface. It helps administrators inspect traffic, identify issues, and save packet captures for detailed analysis in tools like Wireshark.
Basic Syntax:
tcpdump [options] [filter]- List Available Network Interfaces
- Capture Traffic on a Specific Interface
- Capture and Display TCP Traffic in ASCII
- Capture and Display UDP Traffic
- Capture ICMP Traffic
- Capture HTTP Traffic (Port 80)
- Monitor HTTPS Traffic (Port 443)
- Capture HTTP Traffic for a Specific Host
- Capture SSH Traffic for a Specific Host
- Capture TCP Traffic for a Network Range
- Capture HTTP and HTTPS Traffic for a Host
- Capture DNS Traffic and Save to a File
- Capture 5000 Packets and Exclude SSH
- Read a Saved Capture File
1. List Available Network Interfaces
Before starting any packet capture activity, it is important to identify the correct network interface. Modern Linux servers may contain multiple interfaces such as physical adapters, virtual adapters, loopback interfaces, Docker bridges, or VPN connections.
The tcpdump -D command helps administrators quickly determine which interface is actively handling network traffic.
Command: tcpdump -D
2. Capture Traffic on a Specific Interface
This is one of the most commonly used tcpdump command because it captures all packets entering and leaving the selected network interface. As soon as the command starts, tcpdump continuously displays packet information until manually stopped using Ctrl + C.
Command: tcpdump -i ens33
3. Capture and Display TCP Traffic in ASCII
The -A option converts packet payloads into readable ASCII text whenever possible. This allows administrators to inspect application-layer data rather than just packet headers.
When working with unencrypted services, you may be able to see HTTP requests, URLs, cookies, form submissions, and other text-based content directly from the terminal. This makes the command particularly useful for debugging web applications and troubleshooting communication between services.
Because the output can become very large on busy systems, it is often recommended to combine this command with additional filters such as host addresses or specific ports.
Command: tcpdump -A tcp
4. Capture and Display UDP Traffic
Unlike TCP, UDP is a connectionless protocol that does not establish a session before sending data. Many critical network services rely on UDP because of its speed and low overhead.
By using this command, administrators can easily monitor protocols such as DNS, DHCP, SNMP, and NTP.
When investigating DNS resolution issues, for example, this command can help verify whether DNS queries are being sent and whether responses are being received from the DNS server.
Command: tcpdump -A udp
5. Capture ICMP Traffic
ICMP plays a crucial role in network diagnostics and error reporting.
It is commonly associated with the ping command, but it is also used for various network status and error messages. By monitoring ICMP traffic, administrators can determine whether packets are reaching their destination and whether any routing or connectivity issues exist. Messages such as “Destination Unreachable” or “Time Exceeded” can provide valuable clues when diagnosing network failures.
This command is frequently used during firewall testing and network path verification exercises.
Command: tcpdump -A icmp
6. Capture HTTP Traffic (Port 80)
HTTP traffic on Port 80 is transmitted in plain text, making it one of the easiest protocols to inspect using tcpdump.
When capturing HTTP packets with the -A option, you may be able to view complete web requests, URLs, headers, and server responses. This command is particularly useful when troubleshooting web applications, load balancers, reverse proxies, or API integrations.
Developers and system administrators often use it to verify whether requests are reaching the web server correctly. Since modern websites primarily use HTTPS, HTTP traffic is now mostly found in internal networks, testing environments, or legacy applications.
Command: tcpdump -A -i ens33 'port 80'
7. Monitor HTTPS Traffic (Port 443)
Port 443 is used for HTTPS communication, which encrypts data between clients and servers using SSL/TLS protocols.
While tcpdump cannot decrypt HTTPS traffic by default, it can still provide valuable information about connections. Administrators can use this command to verify whether secure connections are being established successfully, identify connection attempts, monitor traffic volume, and troubleshoot network-related SSL issues.
The -n option is particularly important because it prevents reverse DNS lookups, resulting in faster output and more accurate packet analysis.
Command: tcpdump -i ens33 -n port 443
8. Capture HTTP Traffic for a Specific Host
In large enterprise networks, capturing all traffic can quickly become overwhelming.
Filtering by both IP address and port significantly reduces the amount of data displayed and allows administrators to focus on a specific system. This command is ideal when investigating a particular web server, application server, or client device.
It can help determine whether requests are reaching the target host and whether responses are being returned correctly. Such targeted captures are often used during application troubleshooting, incident investigations, and performance analysis.
Command: tcpdump -i ens33 -n host 10.228.13.52 and port 80
9. Capture SSH Traffic for a Specific Host
SSH is one of the most widely used protocols for secure remote administration of Linux and Unix systems.
Capturing SSH traffic can help determine whether connection attempts are reaching the server and whether responses are being generated. Although the contents of SSH sessions are encrypted and cannot be viewed directly, administrators can still analyze connection establishment, session duration, retransmissions, and potential network interruptions.
This command is particularly useful when users report SSH login failures or intermittent connectivity problems.
Command: tcpdump -i ens33 -n host 10.228.13.52 and port 22
10. Capture TCP Traffic for a Network Range
Subnet-level filtering is useful when analyzing traffic across an entire department, office location, data center segment, or VLAN. Instead of focusing on a single host, this command captures all TCP traffic associated with the specified network range.
Administrators commonly use subnet-based captures during network audits, performance monitoring exercises, and security investigations. It provides a broader view of communication patterns between systems within a network segment.
This approach is especially valuable when attempting to identify unusual traffic or unauthorized communications within an internal network.
Command: tcpdump -i ens33 -n tcp and net 10.228.0.0/23
11. Capture HTTP and HTTPS Traffic for a Host
Many modern applications use both HTTP and HTTPS services. This command captures traffic associated with both protocols while focusing on a single host, providing a complete picture of web-related communications.
The use of logical operators such as and and or demonstrates the flexibility of tcpdump’s filtering engine. Administrators can build highly specific filters to capture only the traffic that matters. This command is often used during web application troubleshooting, SSL migration projects, and load-balancer testing.
Command: tcpdump -i ens33 -n 'host 10.228.13.52 and (port 80 or port 443)'Notice the use of single quotes (`’`) around the filter expression. Without quotes, Bash may interpret the parentheses and generate a syntax error.

12. Capture DNS Traffic and Save to a File
Saving traffic directly to a PCAP file allows for deeper analysis using packet analysis tools such as Wireshark.
Rather than viewing packets in real time, administrators can store traffic and examine it later in greater detail. DNS traffic is often the first place to look when investigating connectivity problems because many applications rely on successful hostname resolution.
By capturing DNS packets, you can determine whether queries are reaching the DNS server and whether valid responses are being returned. The resulting PCAP file can also be shared with other engineers or security teams for collaborative troubleshooting.
Command: tcpdump -i ens33 -n port 53 -w dns.pcap
13. Capture 5000 Packets and Exclude SSH
On busy production servers, unrestricted packet captures can quickly consume large amounts of storage space.
The -c option helps control capture size by stopping automatically after a specified number of packets. Excluding SSH traffic can also reduce noise in the capture because administrative SSH sessions are often unrelated to the issue being investigated. This results in cleaner packet captures that are easier to analyze later.
This command is commonly used when collecting evidence for incident response, performance investigations, and troubleshooting activities.
Command: tcpdump -c 5000 -w network.pcap port not 22
Also Read: Top 10 Kali Linux Commands to Check Hardware Information
14. Read a Saved Capture File
The ability to read previously captured packet files is one of tcpdump’s most useful features. Instead of performing a live capture, administrators can revisit stored packet data whenever necessary. This is especially useful when troubleshooting intermittent issues that may no longer be occurring.
Packet captures can be archived, shared with colleagues, or used for training and forensic investigations. You can also combine the -r option with additional filters to focus on specific packets within a large capture file, making analysis more efficient and targeted.
Command: tcpdump -r dns.pcap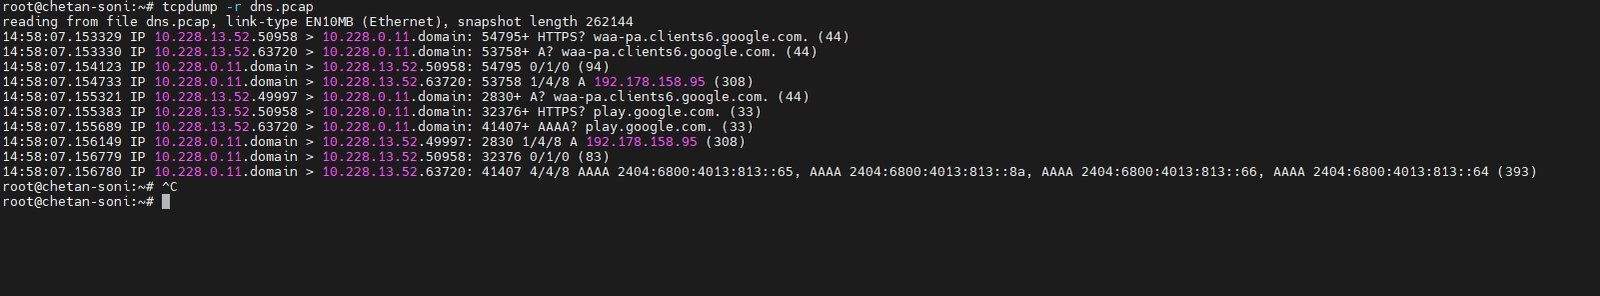
Conclusion
Tcpdump is one of the most valuable troubleshooting tools available on Linux systems. With just a few commands, you can easily monitor HTTP, HTTPS, DNS, ICMP, SSH, and other network traffic, helping you to quickly identify connectivity issues, application problems, and security incidents.