
Monitoring system performance is a critical part of Linux administration. Whether you’re troubleshooting slow applications, investigating storage bottlenecks, or tracking system resource usage, the right monitoring tools can provide valuable insights into what’s happening behind the scenes.
Understanding Linux Performance Monitoring
Performance problems often originate from resource constraints such as CPU saturation, excessive memory consumption, network congestion, or disk bottlenecks. Linux provides several command-line utilities that make it easier to identify these issues in real time.
The tools covered below help you:
- Monitor disk input/output activity
- Track device performance
- Analyze resource consumption by individual processes
- Collect historical performance data
- Troubleshoot system slowdowns
- Log performance metrics for later review
This guide covers seven powerful utilities that help monitor Linux performance, with a particular focus on disk I/O activity, system resources, and process-level analysis.
- iostat (Monitor Disk and Device I/O Statistics)
- sar (Track Linux System Activity Over Time)
- iotop (Monitor Disk I/O by Process)
- dstat (Real-Time Resource Monitoring)
- dool (The Modern dstat Replacement)
- atop (Advanced System and Process Analysis)
- iotop-c (A Faster Alternative to iotop)
1. iostat
The iostat utility is part of the widely used sysstat package. It reports CPU utilization and I/O statistics for storage devices and partitions, making it an excellent tool for identifying disk-related performance issues.
Install iostat
Install the sysstat package using your distribution’s package manager:
sudo apt install sysstat                        # Debian, Ubuntu, Linux Mint
sudo yum install sysstat                        # RHEL, CentOS, Fedora, Rocky Linux, AlmaLinux
sudo emerge -a app-admin/sysstat                # Gentoo
sudo apk add sysstat                            # Alpine Linux
sudo pacman -S sysstat                          # Arch Linux
sudo zypper install sysstat                     # OpenSUSE
Generate a Basic Device Report
To display disk utilization statistics:
iostat -d -t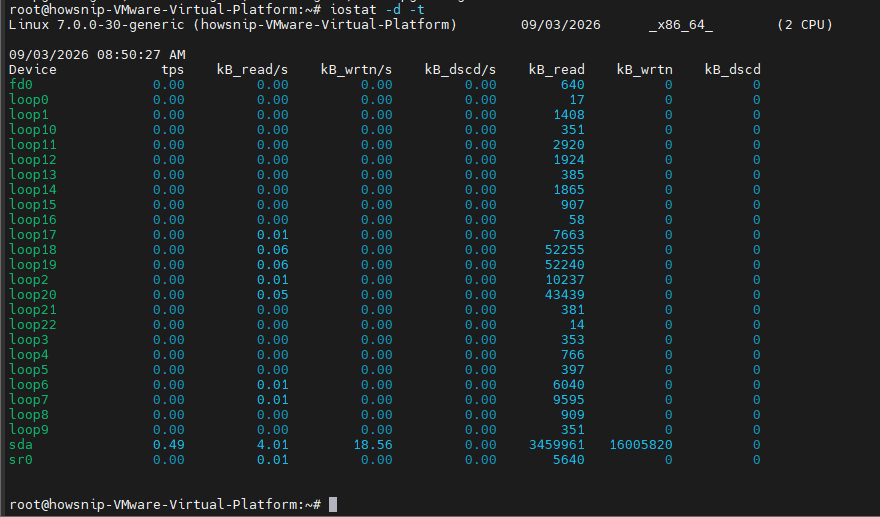
For extended metrics with timestamps:
iostat -d -x -tTo hide inactive devices:
iostat -d -x -t -zDisplay Data in KB or MB
Show statistics in kilobytes per second:
iostat -d -k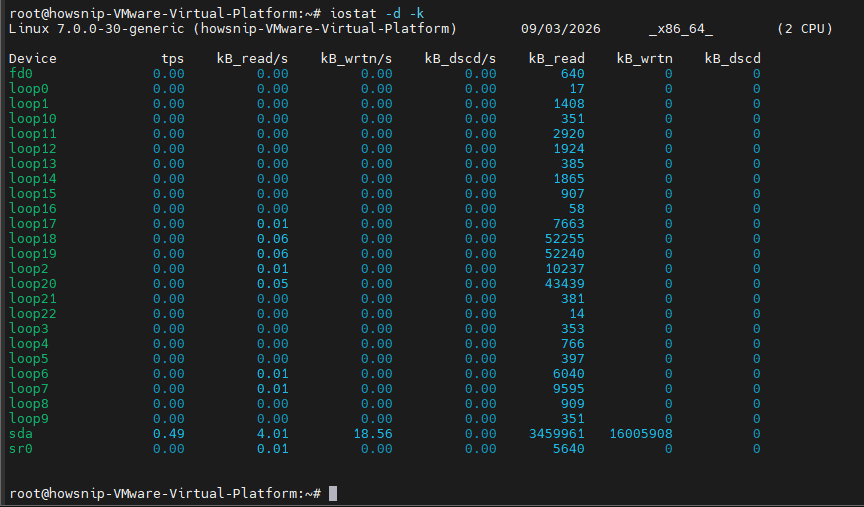
Show statistics in megabytes per second:
iostat -d -mContinuous Monitoring
Generate reports every two seconds:
iostat -d 2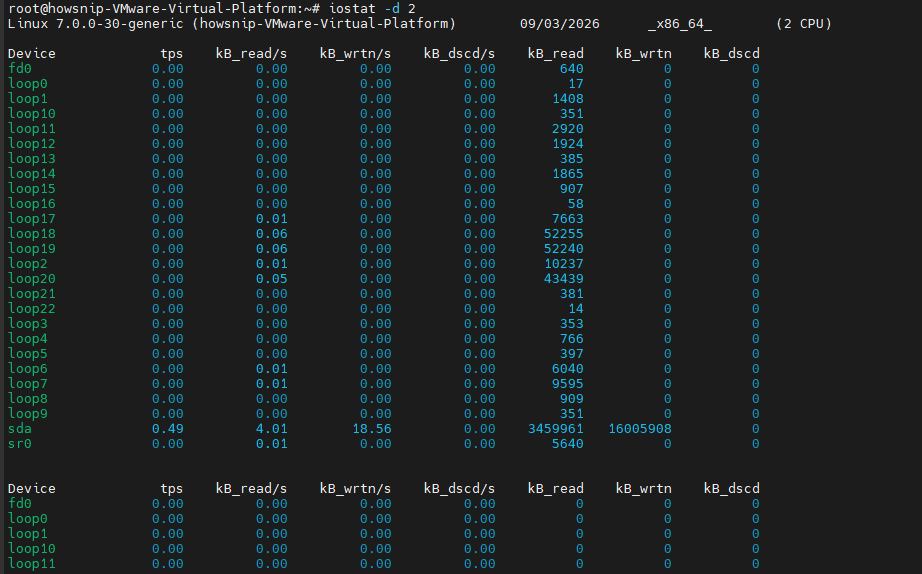
Generate ten reports at two-second intervals:
iostat -d 2 10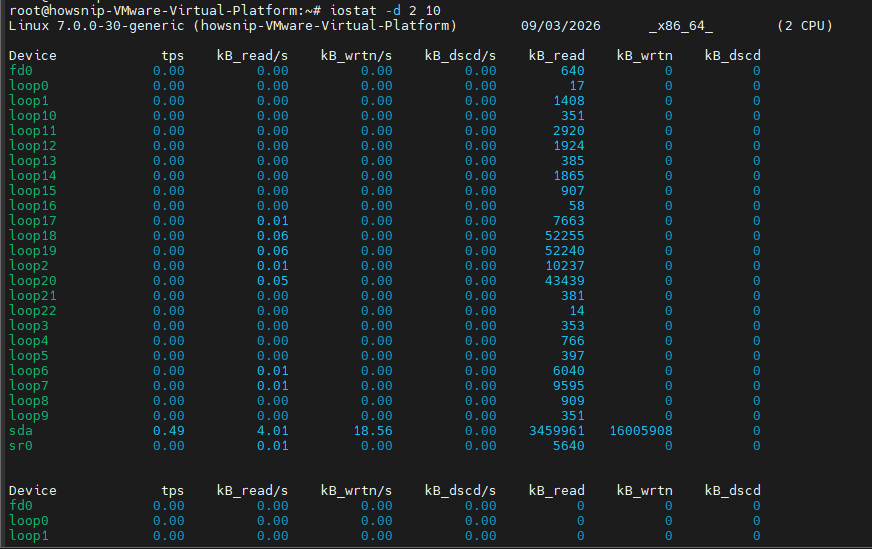
Save output for future analysis:
iostat -d 2 10 > disk_io_report.txt &
For a detailed explanation of each metric, consult:
man iostat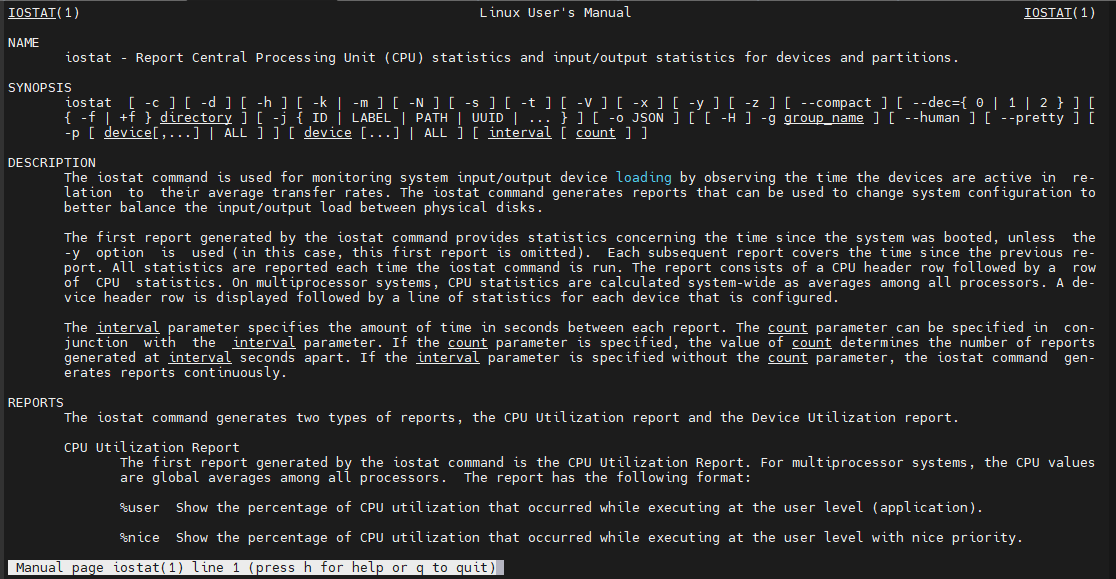
2. sar
The sar utility, also included in the sysstat package, collects and stores system performance information for historical analysis. Unlike real-time monitoring tools, sar allows administrators to review performance trends and investigate issues after they occur.
Enable Data Collection
Edit the sysstat configuration file:
sudo vi /etc/default/sysstat
or
sudo nano /etc/default/sysstat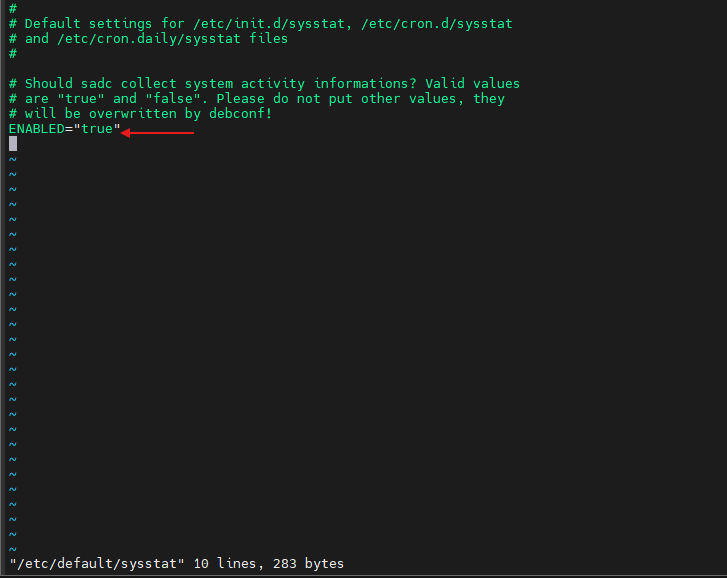
Ensure the following setting is enabled:
ENABLED="true"Adjust Collection Frequency
Modify the collection interval in:
/etc/cron.d/sysstat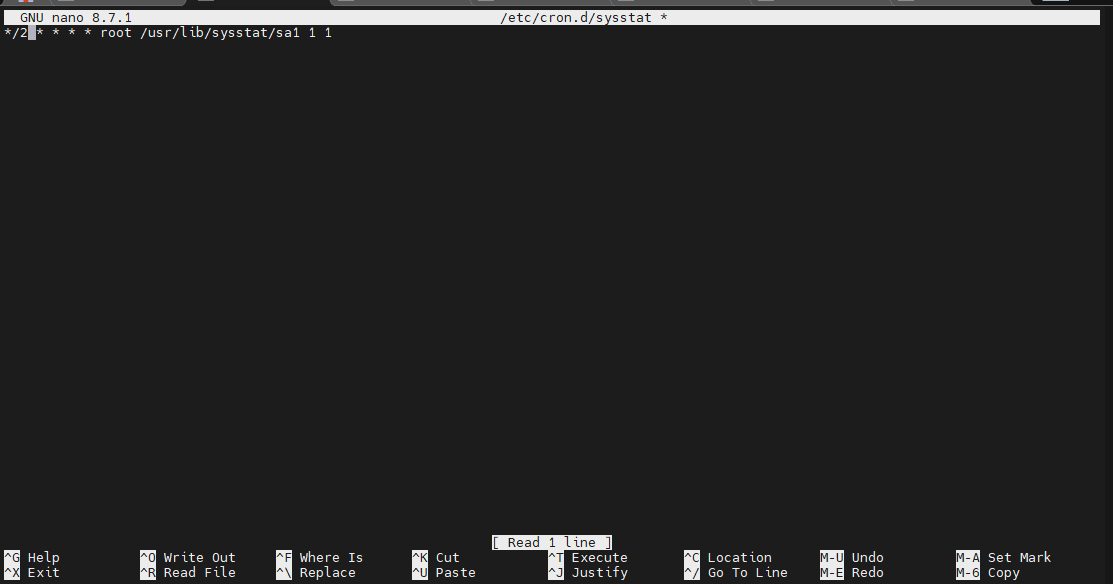
The default interval is typically 10 minutes. You can reduce it to every 2 minutes if more granular data collection is required.
Start the Service
Enable and start sysstat:
systemctl enable --now sysstat.service
systemctl start sysstat.service
View Disk Activity Reports
After data has been collected, use:
sar -d -b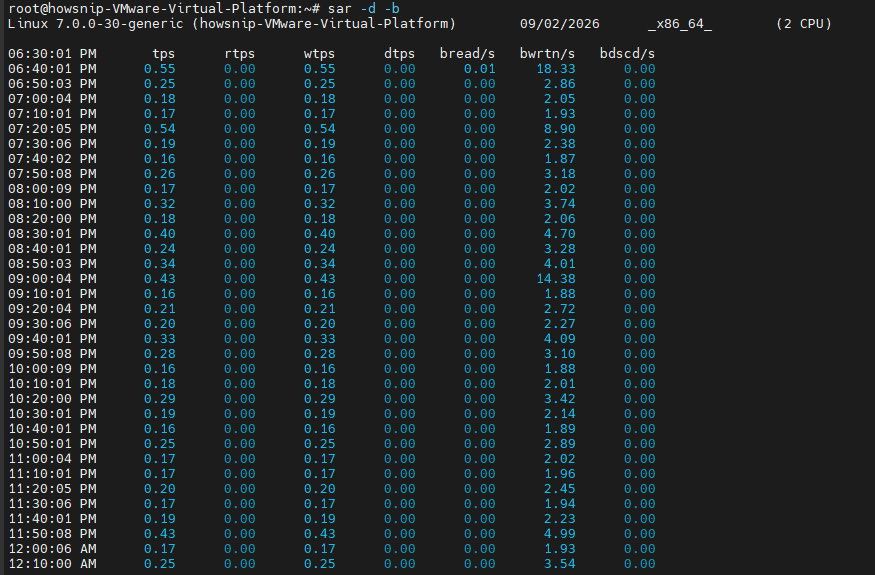
This command displays block device activity and transfer-rate statistics, helping identify storage performance bottlenecks.
3. iotop
iotop provides a process-oriented view of disk activity. Its interface resembles the popular top utility but focuses specifically on storage input/output operations. This makes it easy to discover which processes are generating heavy disk activity.
Install iotop
sudo apt install iotop                             # Debian, Ubuntu, Linux Mint
sudo yum install iotop                             # RHEL, CentOS, Fedora, Rocky Linux, AlmaLinux
sudo emerge -a sys-process/iotop                   # Gentoo
sudo apk add iotop                                 # Alpine Linux
sudo pacman -S iotop                               # Arch Linux
sudo zypper install iotop                          # OpenSUSE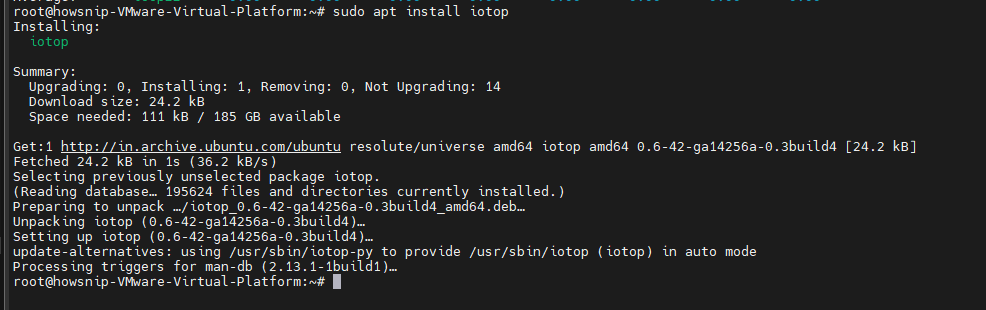
Start Monitoring
Launch with default settings:
iotopChange the refresh interval to two seconds:
iotop -d 2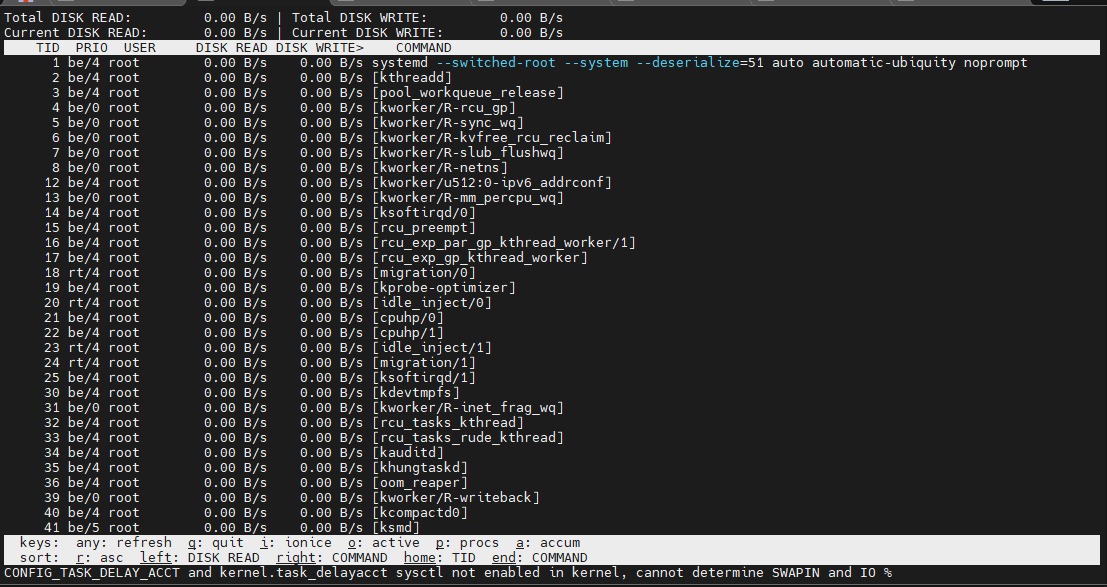
Display Processes Only
By default, threads are shown individually. To display only processes:
iotop -P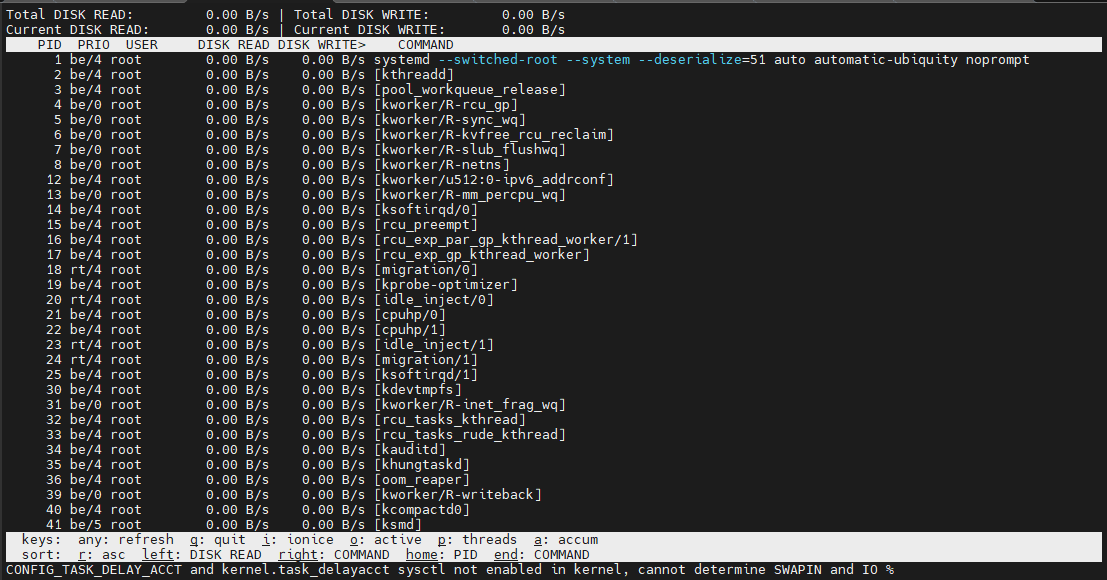
Show Accumulated I/O
To view cumulative disk activity since startup of the monitoring session:
iotop -P -a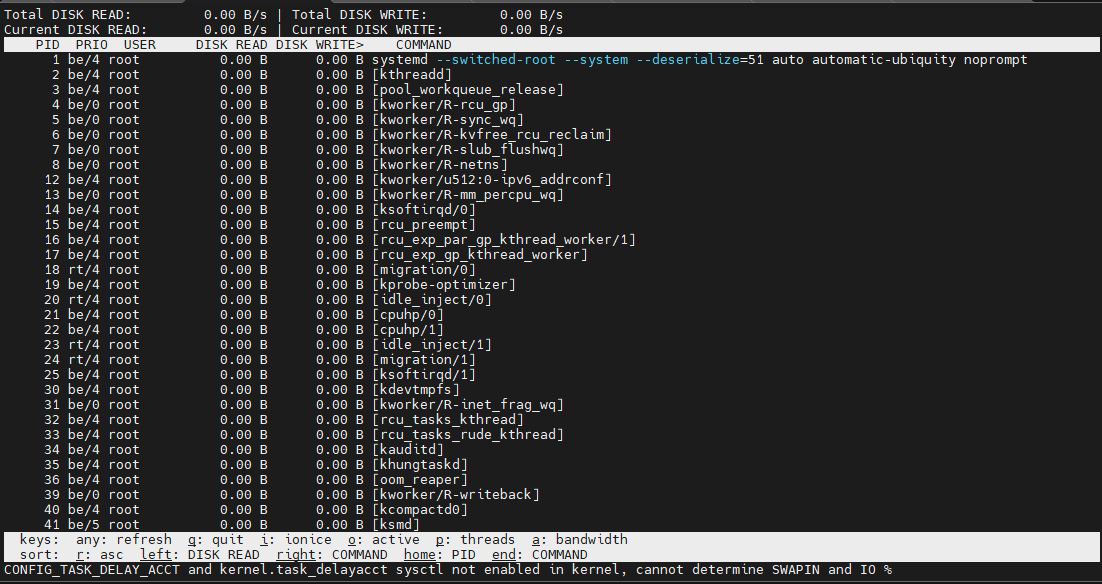
This view is particularly useful when analyzing long-running workloads.
4. dstat
dstat combines the functionality of several traditional Linux monitoring tools into a single interface. It can display CPU, memory, disk, and network statistics simultaneously. Development of dstat has ended. The original maintainer recommends migrating to dool, an actively maintained project that remains fully compatible with existing dstat commands.
Although dstat continues to function on many Linux systems, new deployments should generally consider dool.
Install dstat
sudo apt install dstat
sudo yum install dstat
sudo emerge -a sys-process/dstat
sudo apk add dstat
sudo pacman -S dstat
sudo zypper install dstat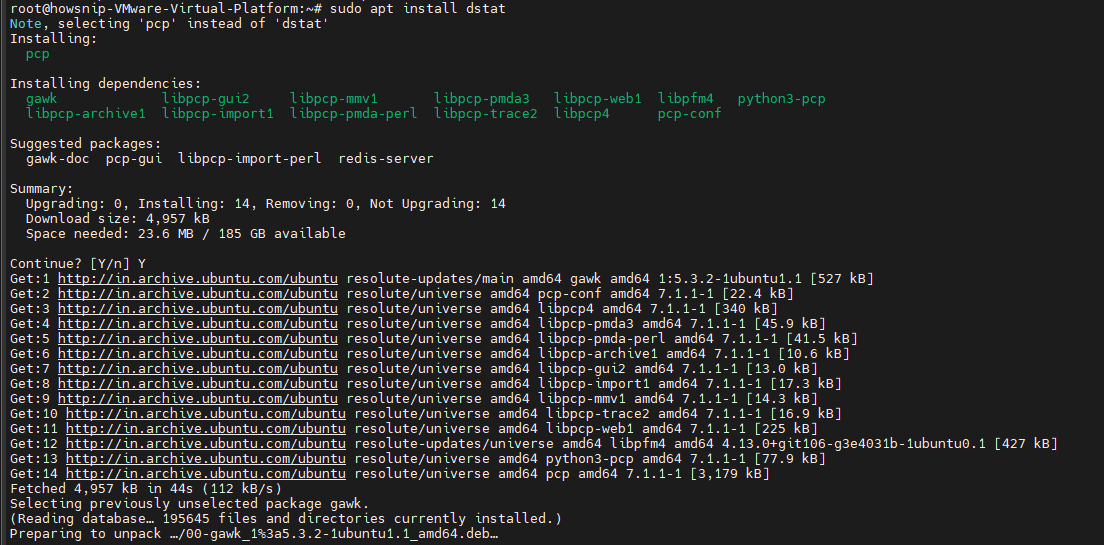
Basic Usage
Monitor CPU, disk, and network activity:
dstat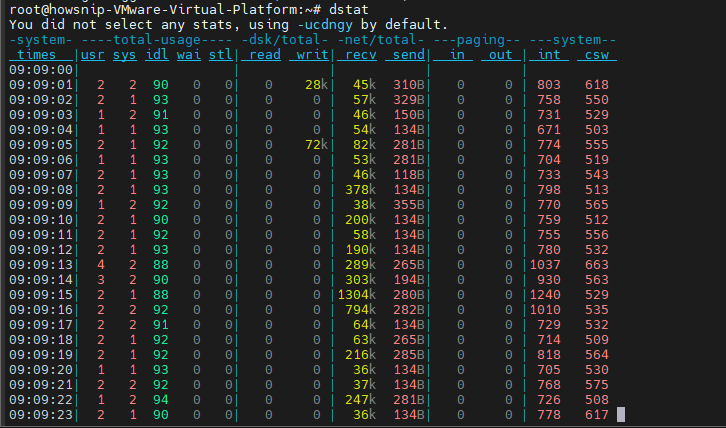
View disk statistics only:
dstat -d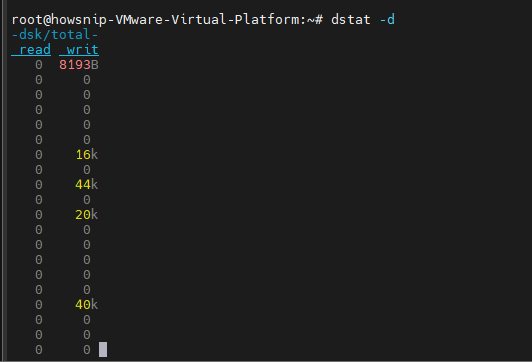
Monitor CPU, memory, and storage together:
dstat -cdm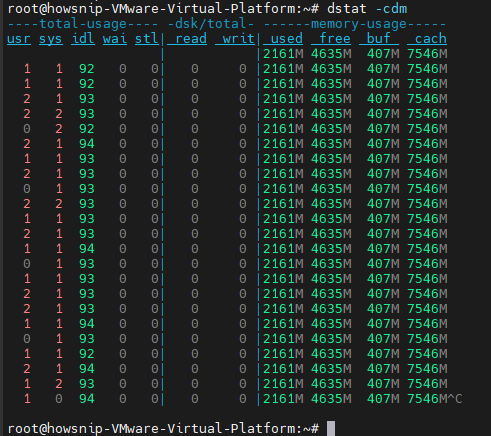
Export metrics to CSV:
dstat -cdm --output system_stats.csv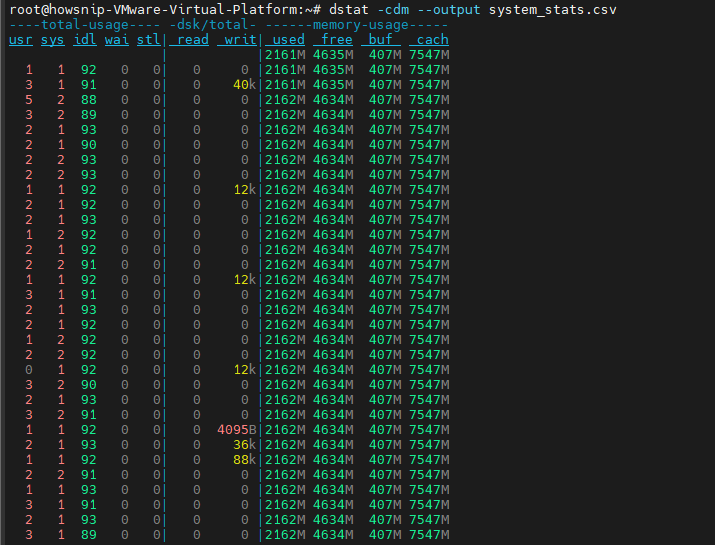
5. dool
dool is the actively maintained successor to dstat. It preserves command compatibility while introducing ongoing fixes and improvements. Because it uses the same command syntax, transitioning from dstat is straightforward.
Install dool
git clone https://github.com/scottchiefbaker/dool.git
cd dool
sudo ./install.py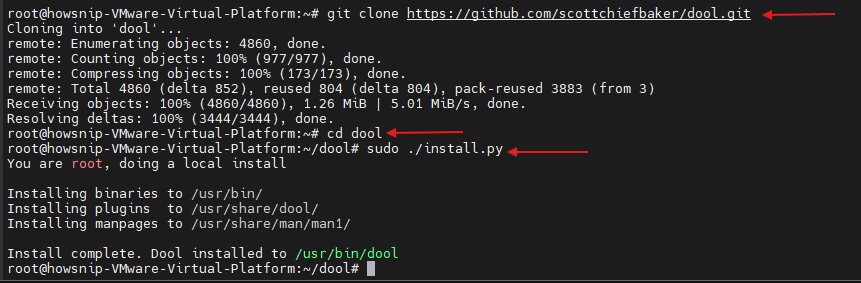
Common Commands
Start monitoring:
dool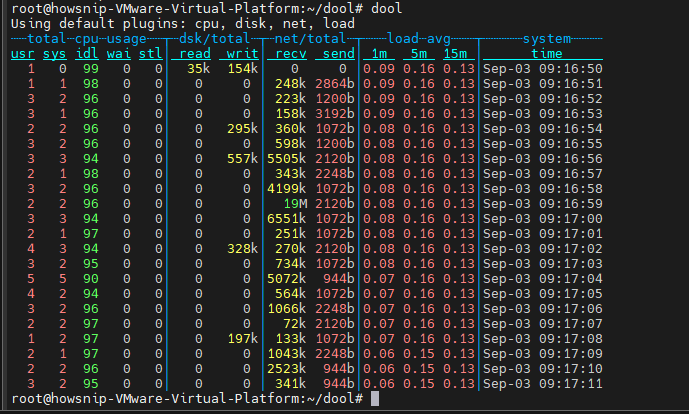
Track disk activity:
dool -d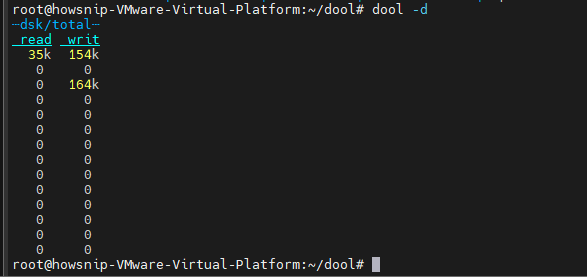
Monitor CPU, memory, and disk together:
dool -cdm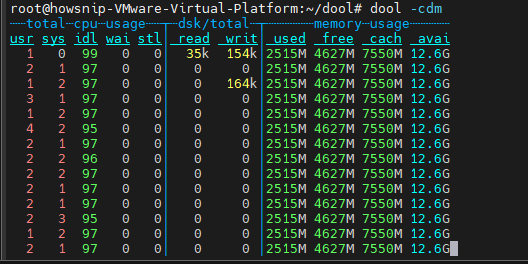
For administrators looking for long-term support and active development, dool is generally the preferred choice.
6. atop
atop provides comprehensive monitoring across CPU, memory, storage, and network resources. It is often used when more in-depth analysis is required. One of its strongest features is automatic logging, which allows administrators to investigate past performance events.
Install atop
sudo apt install atop
sudo yum install atop
sudo emerge -a sys-process/atop
sudo apk add atop
sudo pacman -S atop
sudo zypper install atop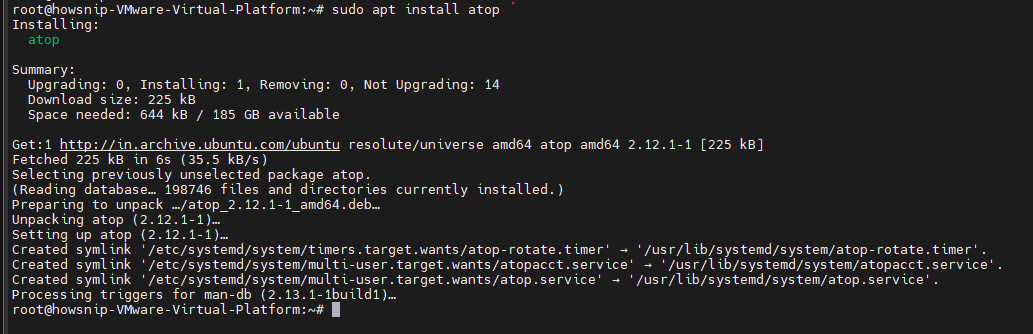
Launch atop
atop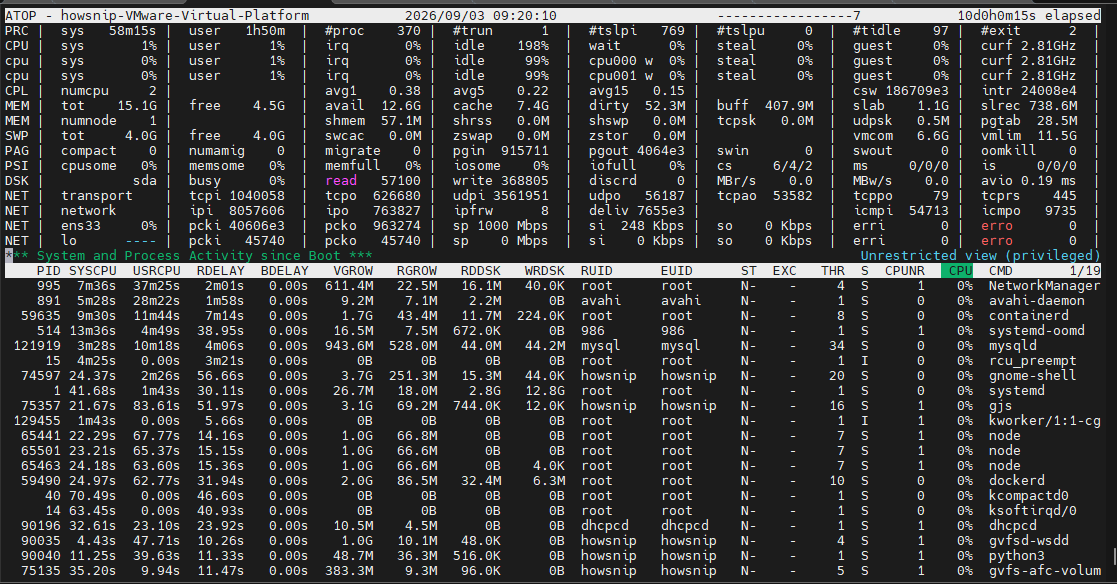
By default, the display refreshes every 10 seconds.
To reduce the interval:
atop 2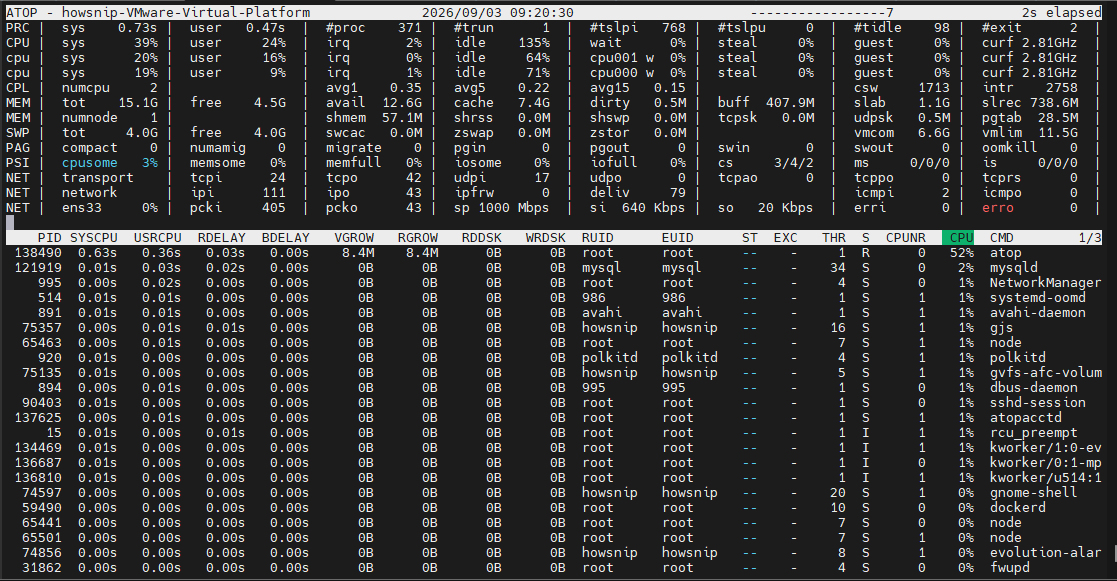
Analyze Historical Data
Replay stored log files:
atop -r /var/log/atop/atop_YYYYMMDD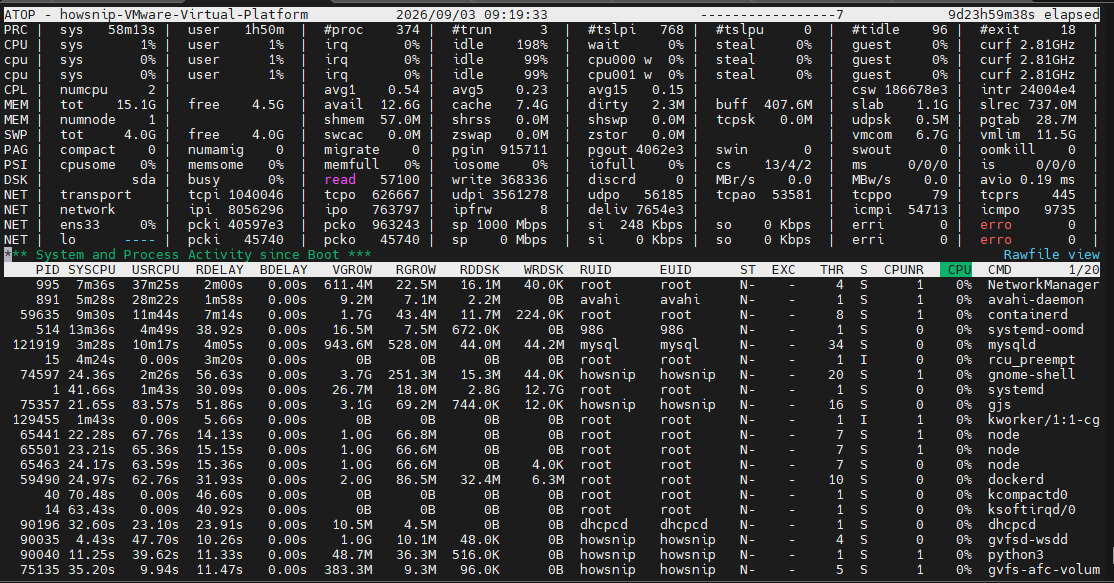
This capability makes atop especially useful when diagnosing issues that occurred earlier in the day or overnight.
7. iotop-c
iotop-c is a modern alternative to the original iotop. Written in C rather than Python, it is designed to deliver faster updates and lower resource consumption. It maintains a familiar interface while improving efficiency, especially on busy systems.
Install iotop-c
sudo apt install iotop-c
sudo yum install iotop-c
sudo pacman -S iotop-c
Launch the Tool
iotop-c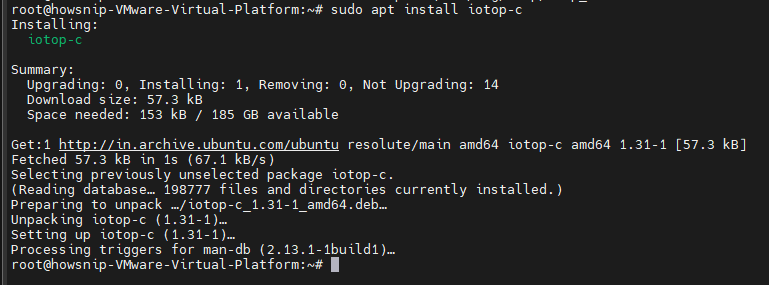
Common Commands
Processes only:
iotop-c -P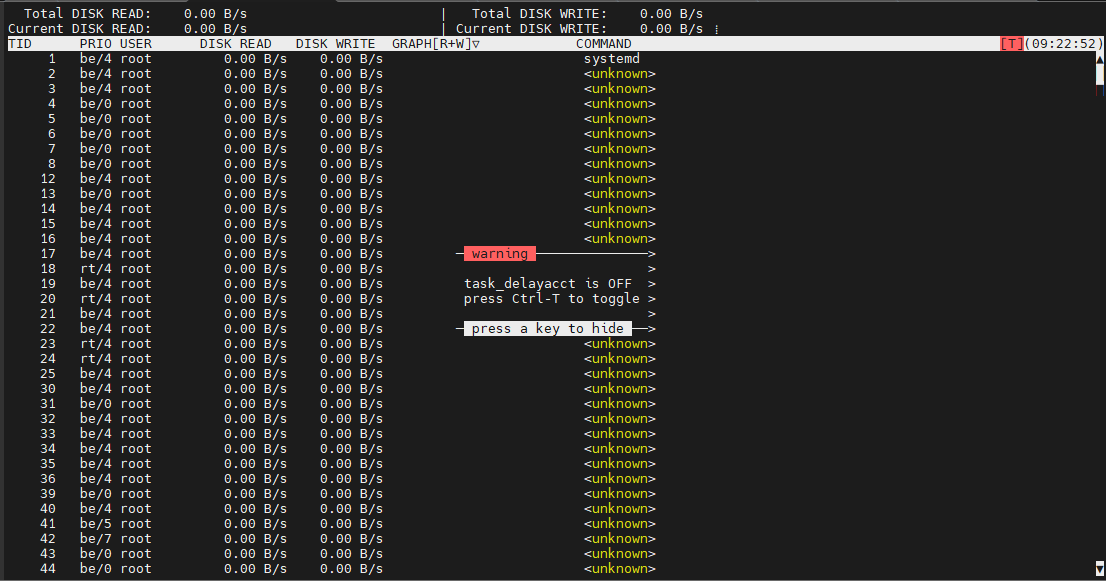
Accumulated disk I/O:
iotop-c -a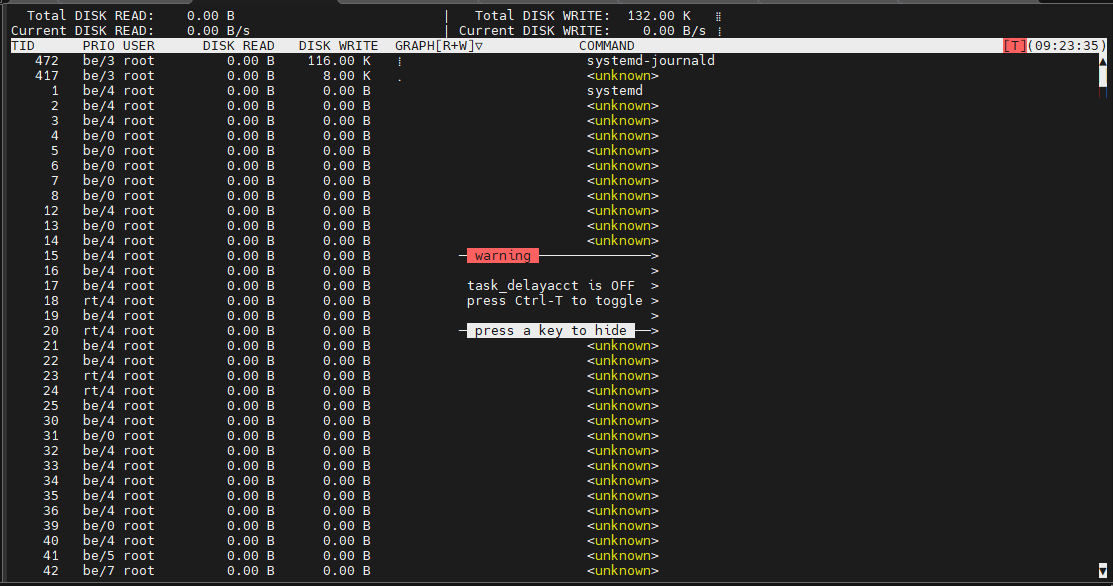
Two-second refresh interval:
iotop-c -d 2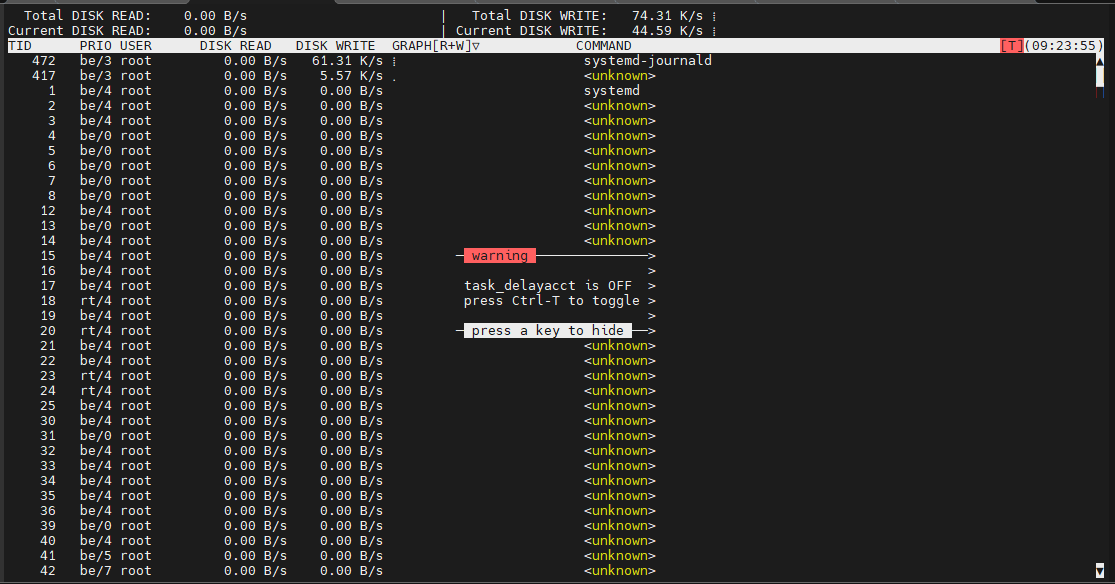
Because its syntax closely matches iotop, existing users can switch with minimal effort.
Frequently Asked Questions
Which tool is best for monitoring disk I/O in Linux?
iostat, iotop, and iotop-c are among the most effective options. iostat focuses on device performance, while iotop and iotop-c identify which processes are generating disk activity.
What is the difference between dstat and dool?
dool is an actively maintained fork and successor to dstat. It supports the same commands while continuing development and receiving updates.
Can sar provide historical performance data?
Yes. sar collects and stores system activity information, allowing administrators to review past CPU, memory, and disk performance metrics.
Which Linux monitoring tool is best for troubleshooting past issues?
atop is particularly useful because it automatically records performance information and allows playback of historical logs.
Conclusion
Effective Linux performance monitoring requires visibility into both current activity and historical trends. Tools such as iostat, sar, iotop, dool, atop, and iotop-c provide administrators with the information needed to diagnose disk bottlenecks, track resource consumption, and maintain stable system performance.
By combining these utilities, you can build a comprehensive monitoring strategy that helps identify and resolve issues before they impact users.